
Table of Contents
Rating scales have a credibility problem that predates almost every HR team currently dealing with one. Employees distrust them. Managers cluster everyone in the middle to avoid hard conversations. HR inherits a scale from a prior director or an HRIS default and never revisits whether it actually measures anything. And yet the alternative, no structured rating at all, leaves compensation, promotion, and succession decisions without any defensible basis.
Industry analyst Josh Bersin has spent two decades studying this exact tension. After a decade of organizations debating whether to abandon ratings, his conclusion was direct: ratings themselves were never the core issue. Organizations inherently need to make evaluative decisions about people: who gets promoted, who gets more pay, who needs a different role, and those decisions are evaluative by nature whether or not a number is attached. The real lever, in his framing, is whether the data behind the decision is good, the process is transparent, and managers apply the scale consistently.
This guide covers every major rating scale type in use today, the specific biases that distort ratings regardless of scale design, a practical calibration process, and a decision framework for choosing the right scale for your organization’s size and maturity. It also covers what most competing guides skip: how the rating scale should connect to goal attainment, development planning, and engagement, rather than functioning as an isolated form field.
What Is a Performance Review Rating Scale?
A performance review rating scale is a standardized system for scoring employee performance during formal evaluation periods, converting a manager’s qualitative judgment into structured, comparable data. It provides a consistent measure across individuals, teams, and review cycles that HR and leadership can use for compensation decisions, promotion readiness, succession planning, and development tracking. Scales serve two functions at once: they structure the review conversation itself, and they produce the data record that decisions get built on. A scale that managers cannot apply consistently fails at both.
Why Rating Scales Still Matter
In Deloitte’s Bersin research on high-impact performance management, the process was found to be widely unpopular among employees, with a measured net promoter score around negative 60, yet 96 percent of companies still conduct formal performance reviews and 86 percent still use some form of rating. That gap, between how disliked the process is and how universally it persists, is the strongest evidence that ratings solve a real organizational need even when poorly executed.
Culture Amp’s own research adds a second, more direct reason ratings matter: how an employee is rated shapes how they experience fairness and growth at work. Their analysis found employees who feel their performance was evaluated fairly report meaningfully higher engagement, while employees who strongly disagree that their evaluation was fair are far more likely to leave within the following year. The rating itself becomes a trust signal, independent of the score.
Practitioner Insight: HR teams sometimes treat the rating scale as the entire performance management decision, debating 4-point versus 5-point for months while the actual driver of fair outcomes, whether managers received real calibration training, gets a single slide in a rollout deck. The scale matters less than whether two managers rating the same employee profile would land on the same score.
Types of Performance Review Rating Scales
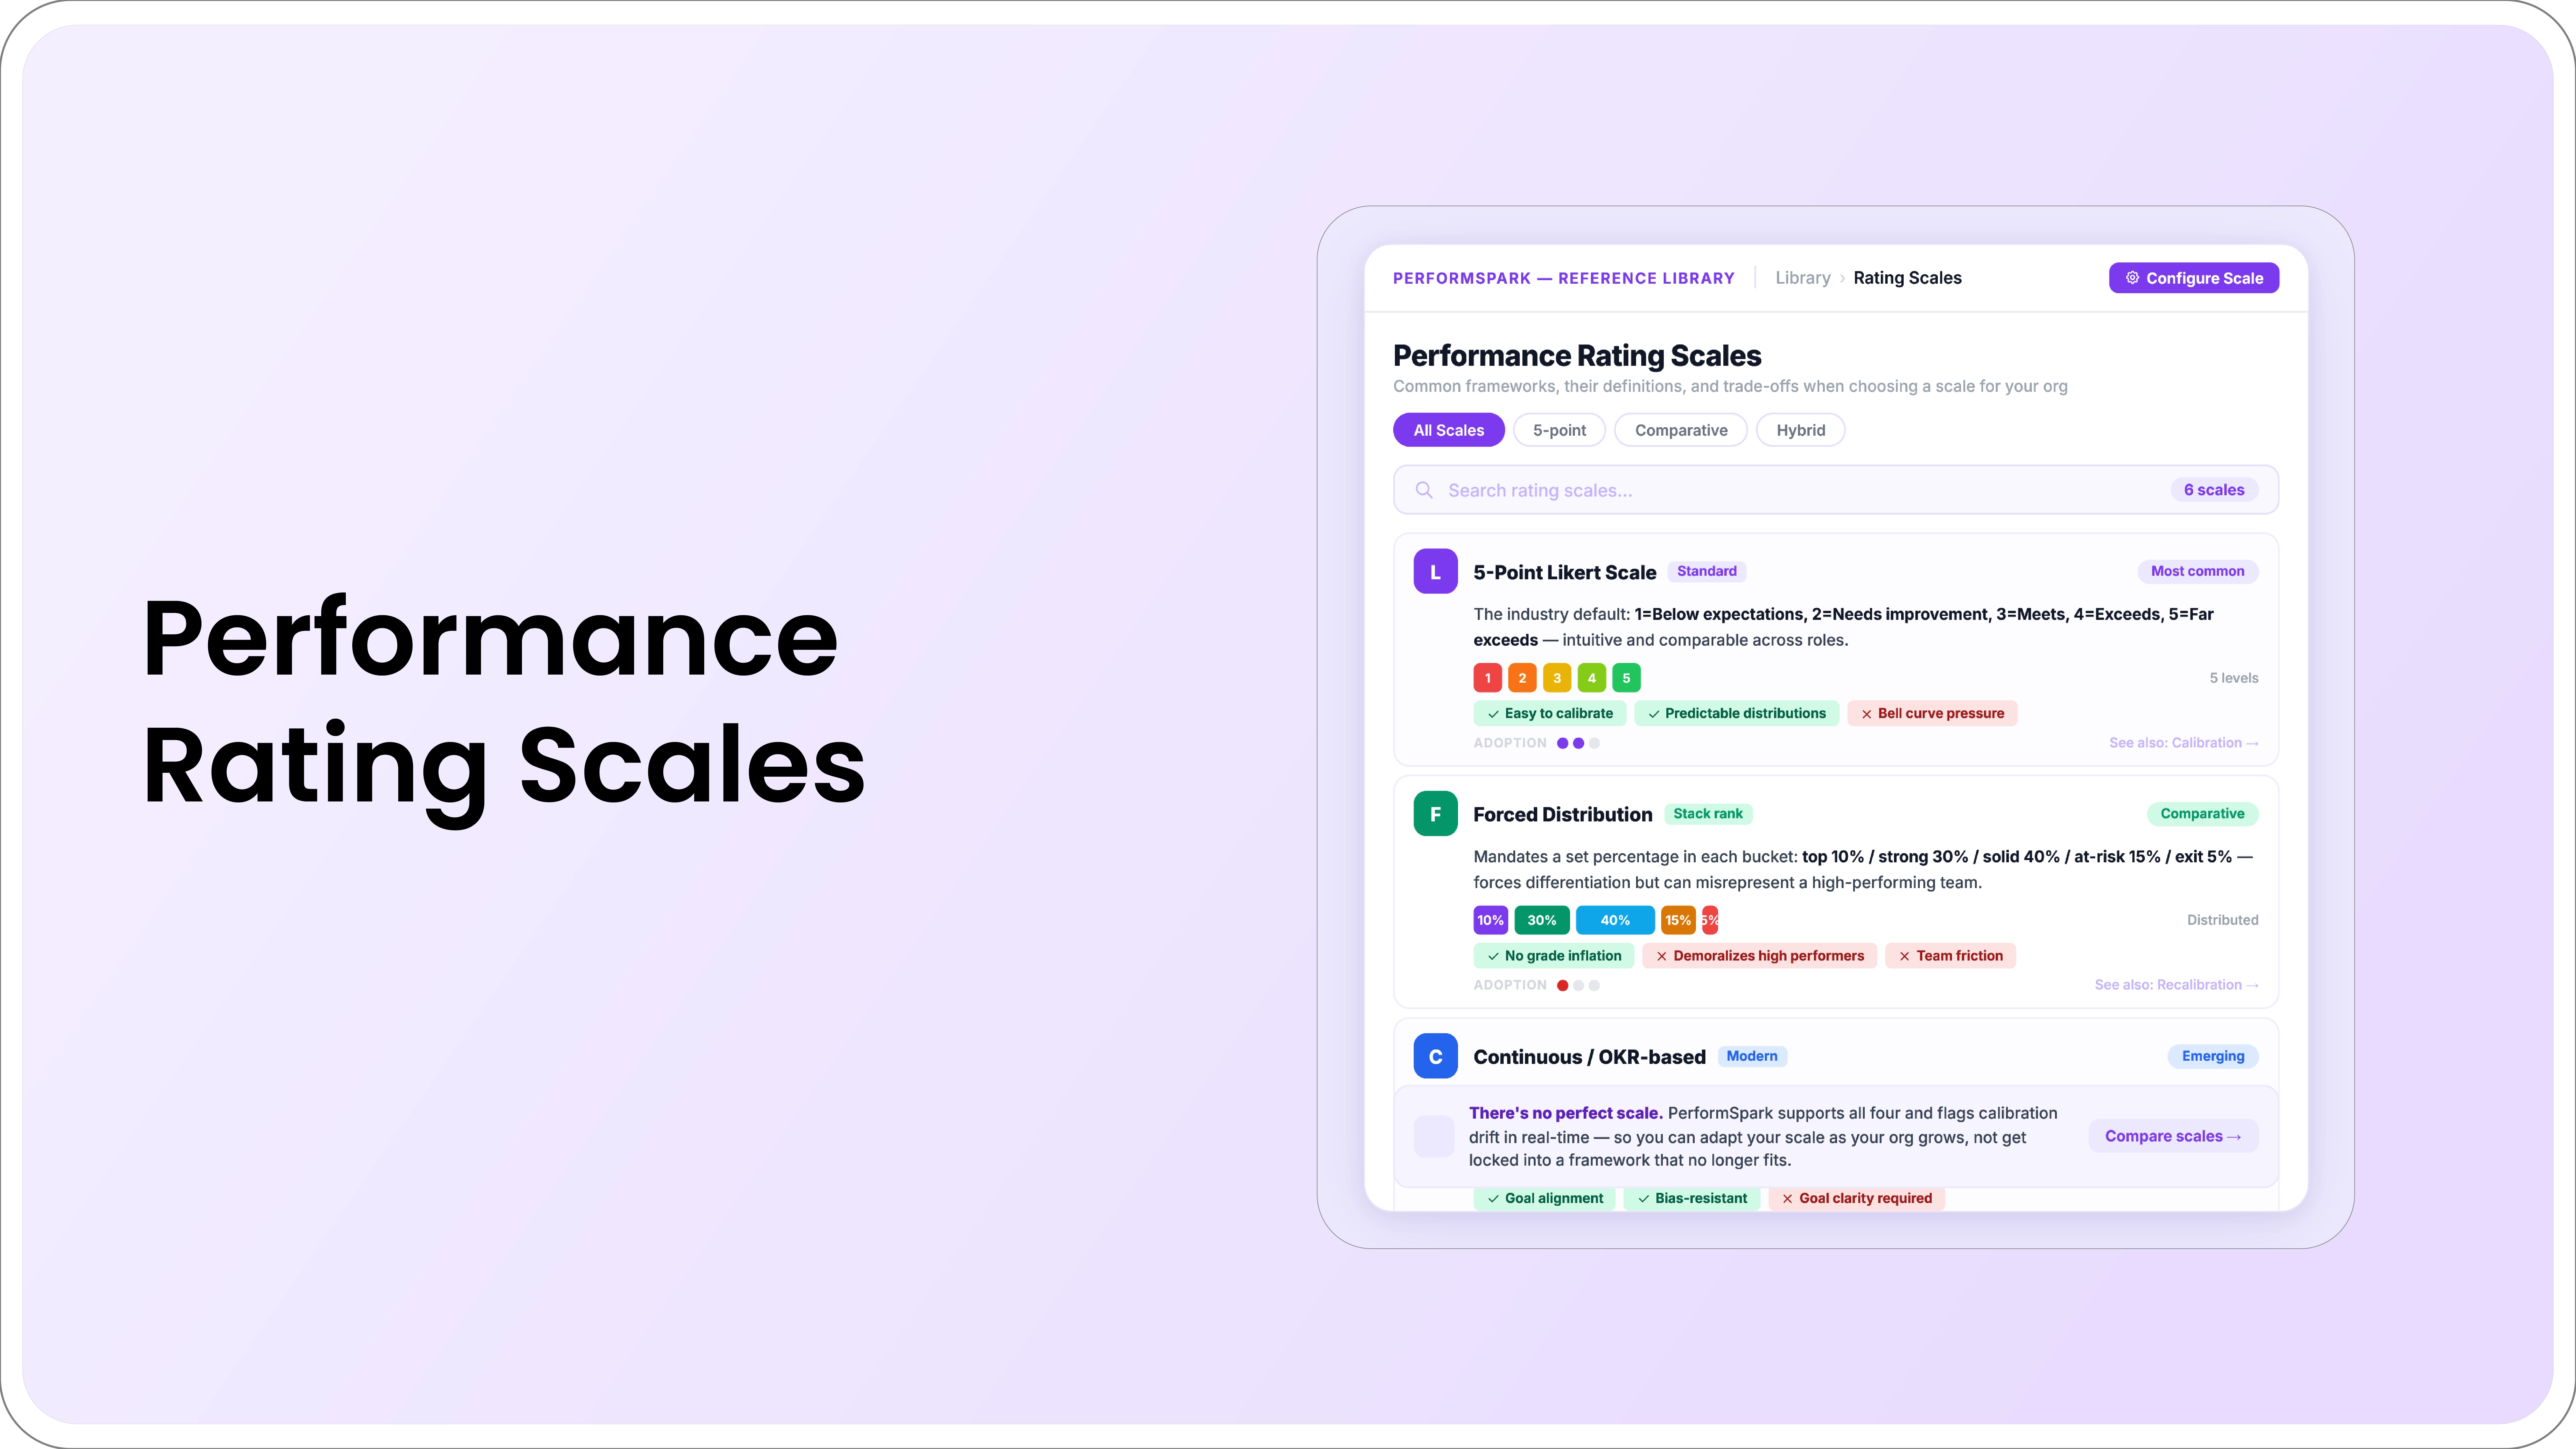
No competing guide covers the full range of scale types in one place. Here is every major format in current use, what it looks like, and where it fits.
3-Point Scale
A three-tier system, typically "Does Not Meet Expectations," "Meets Expectations," and "Exceeds Expectations." Best for organizations running their first structured review cycle or small manager groups where informal calibration is realistic. The tradeoff is that most employees land in the middle tier, and the scale struggles to differentiate solid performers from genuinely exceptional ones.
4-Point Scale
A four-tier system that deliberately removes the neutral middle option, often "Needs Development," "Meets Expectations," "Exceeds Expectations," and "Sets a New Standard." This is the most widely used scale in real-world practice. Removing the midpoint forces a directional decision and reduces central tendency clustering, at the cost of requiring sharper definitions between adjacent tiers.
5-Point Numerical and Descriptive Scales
The most familiar format: a 1 to 5 score, either numeric only or paired with anchor labels at each point. Best for mid-market organizations tying ratings to compensation bands. The well-documented risk is central tendency bias, scores clustering at 3, which without calibration can effectively collapse a five-point scale into a three-point scale in practice.
7-Point and 10-Point Scales
Wider scales offer finer differentiation, useful for organizations doing detailed performance analytics or research-driven workforce planning. The tradeoff grows sharply with scale width: managers and employees alike struggle to articulate what genuinely separates a 7 from an 8, and inter-rater consistency tends to degrade as the number of points increases without proportionally more training investment.
Behaviorally Anchored Rating Scale (BARS)
Each point on a BARS scale is defined by a specific, observable behavior tied to the role rather than a generic descriptor. A BARS entry for a customer-facing competency might define a top rating as proactively resolving issues before a client raises them, and a bottom rating as ignoring or mishandling complaints. BARS produces the most consistent ratings of any format because raters compare actual behavior to a written example instead of interpreting an abstract label, but it requires significant upfront design work per role and ongoing maintenance as roles evolve.
Likert Scales
A symmetric agreement scale, typically "Strongly Disagree" to "Strongly Agree," used to rate agreement with a specific statement. Likert scales fit engagement surveys and 360-degree feedback instruments well but are a weaker primary instrument for individual output-focused performance reviews, since agreement with a general statement is a different measurement task than scoring delivered output.
Graphic and Custom Scales
A graphic scale presents a sliding visual bar rather than discrete tiers, intuitive to use but carrying the same bias risks as any other format if used without written feedback alongside it. A custom scale replaces generic labels with language specific to a company’s values or competency framework. Custom scales increase relevance and buy-in but make cross-department calibration harder, since the meaning of each tier has to be taught rather than assumed.
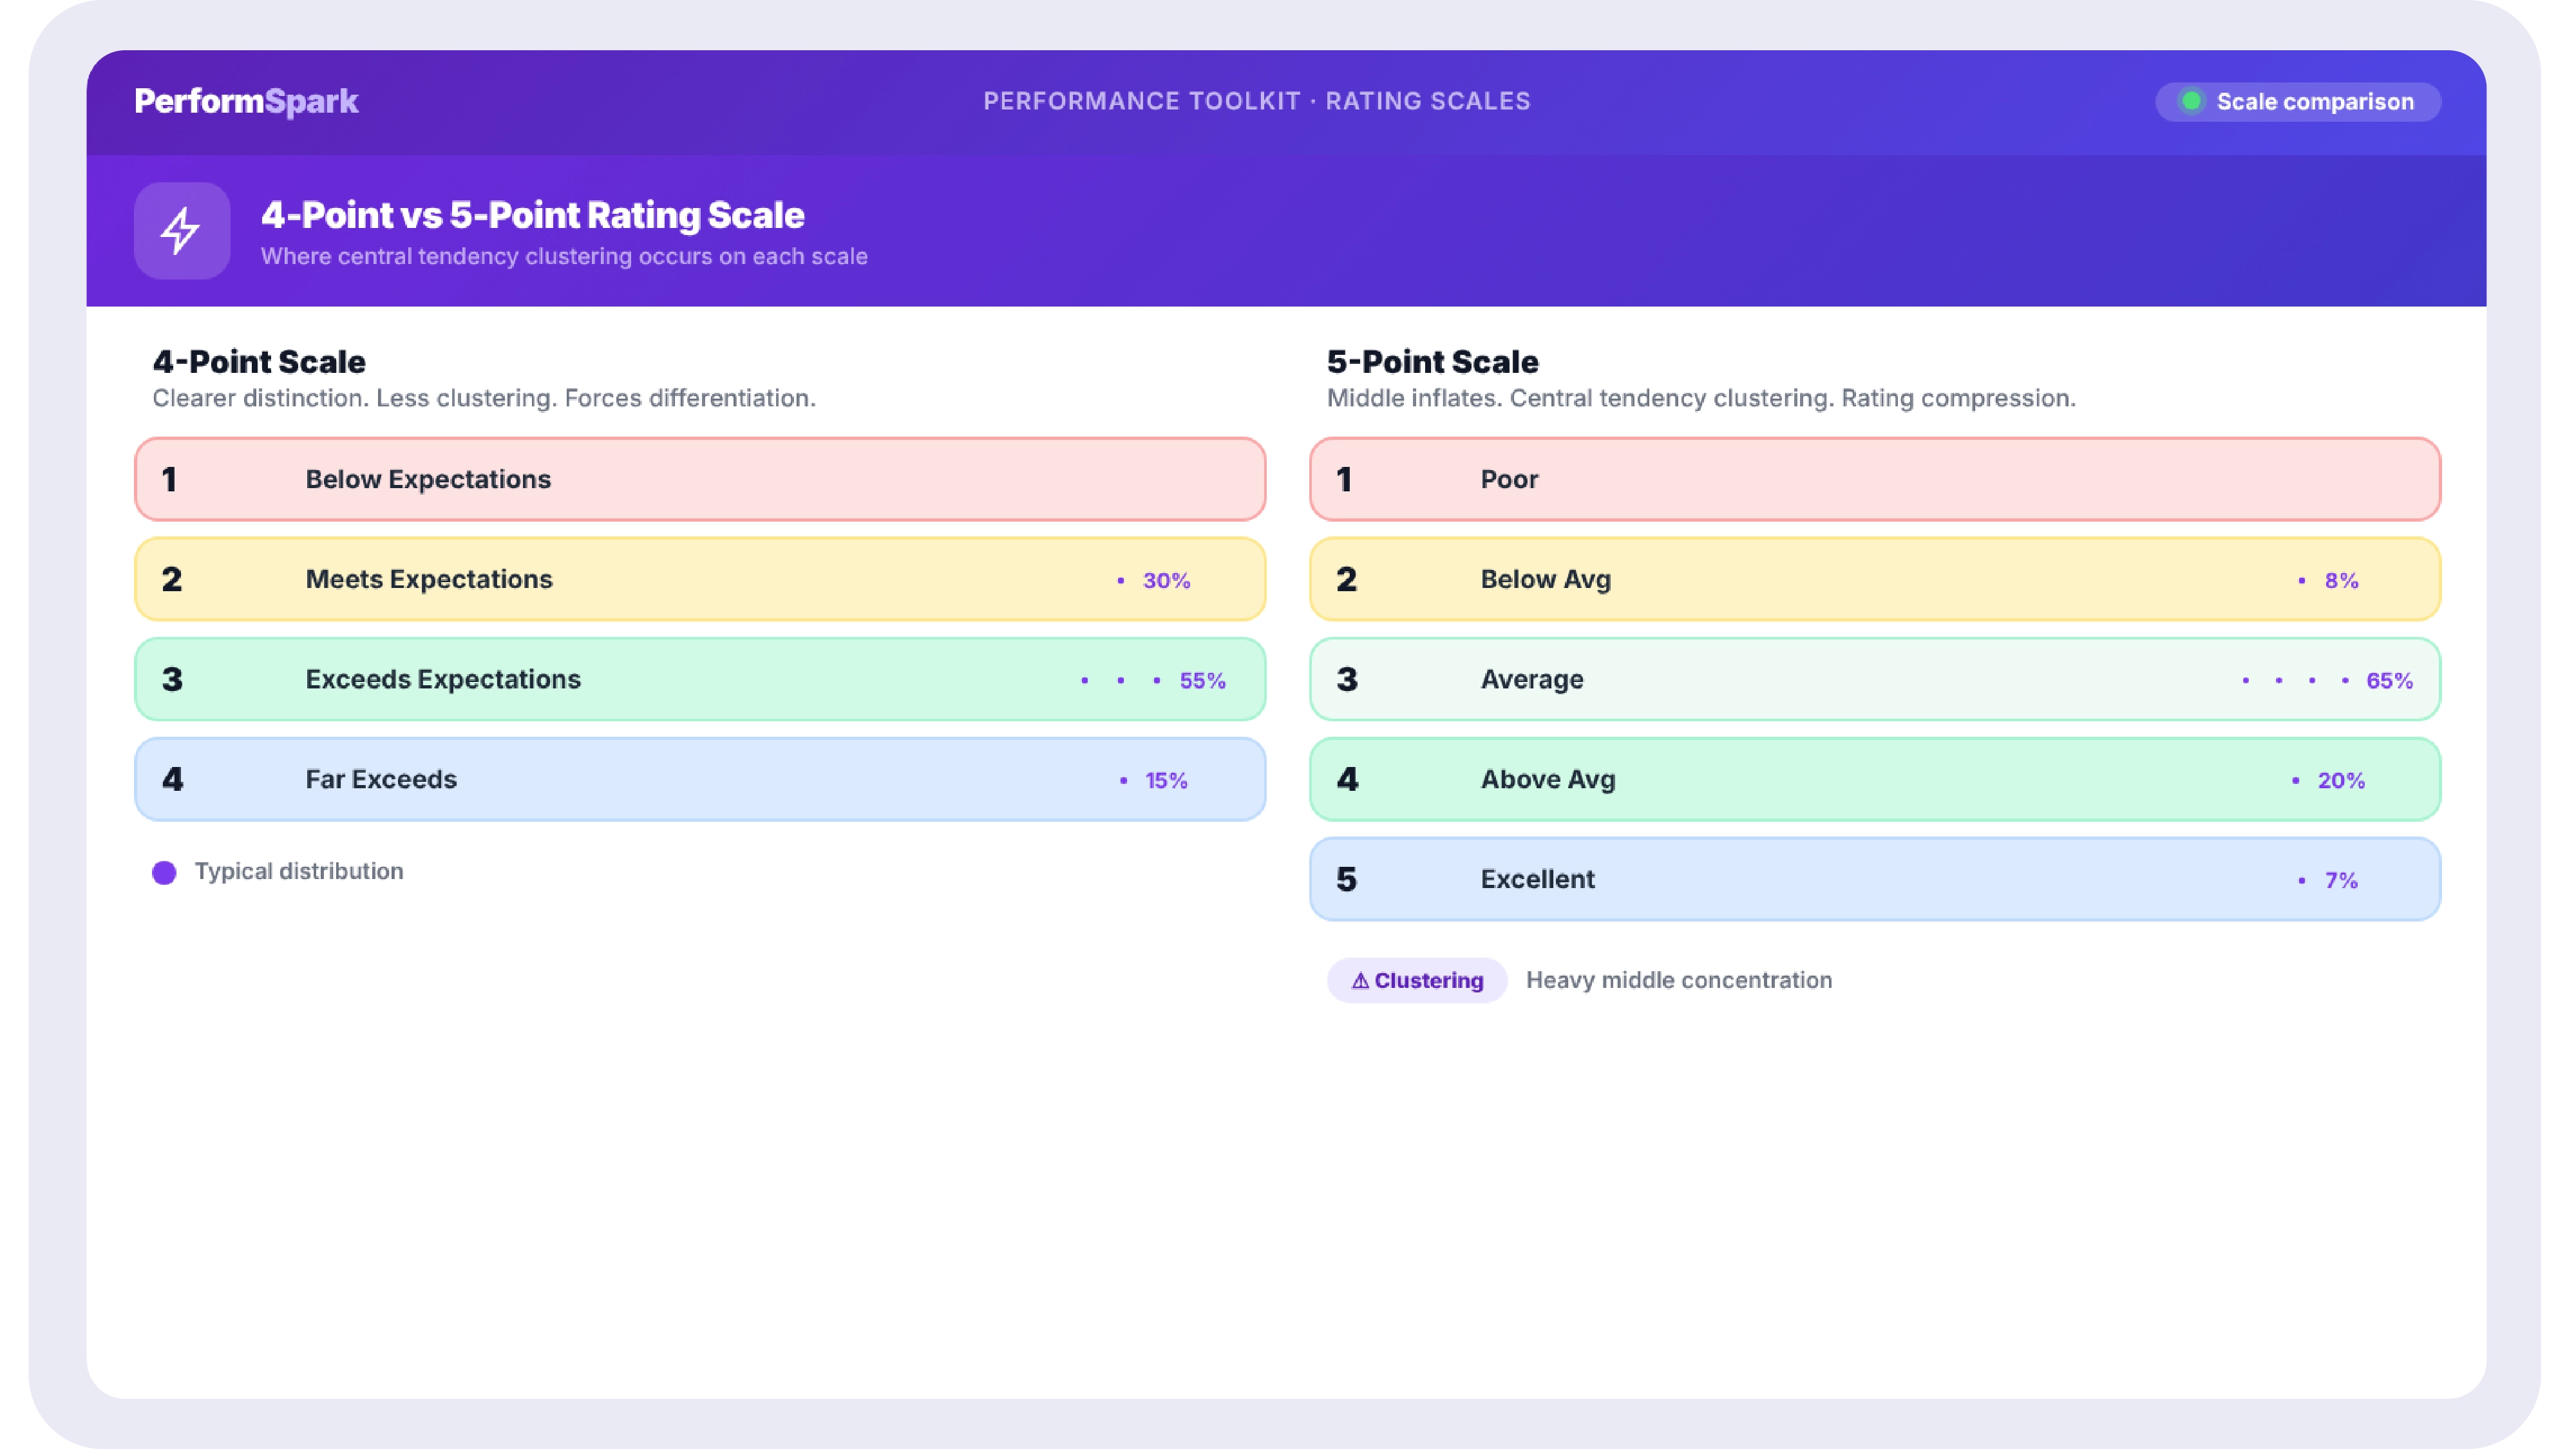
4-Point vs 5-Point Rating Scale: Which Is More Common?
According to Culture Amp’s analysis of standardized rating data across more than 462,000 employees and over 1,500 companies, 52 percent of organizations use a 4-point scale and 31 percent use a 5-point scale, making these two formats the practical default for most mid-market and enterprise reviews. The choice between them is less about which is objectively better and more about whether removing the neutral midpoint, the core difference between a typical 4-point and 5-point design, fits a culture’s tolerance for forced directional ratings.
The Most Common Rating Scale Biases
Two researchers cited by Bersin, drawing on studies published in Personnel Psychology and the Journal of Applied Psychology, found that close to half the variation in performance ratings is explained by which manager is doing the rating, not by the employee’s actual performance. Scale design alone cannot fix that. The specific biases below are what produce it.
- Central tendency bias. Managers default to the middle rating to avoid conflict or appear fair, flattening real performance differences and reducing a five-point scale to a de facto three-point scale in practice.
- Leniency bias. Managers rate consistently higher than performance warrants, often to stay popular or avoid a difficult conversation, leading to rating inflation that makes top performers indistinguishable from solid ones.
- Recency bias. Only the last few weeks before the review get weighted, while the first months of the cycle are effectively forgotten, disadvantaging employees who were strong early but had a rough final stretch.
- Halo and horn effects. One standout positive trait, or one notable failure, colors every other rating dimension regardless of actual performance in those specific areas.
- Similarity bias. Managers rate employees who share their own background, communication style, or working approach more favorably, which compounds into measurable inequity at scale.
- Contrast effect. A rating is unconsciously anchored against the immediately preceding review. An average performer reviewed right after a weak one can appear stronger than they actually are, and vice versa.
Practitioner Insight: Culture Amp’s own word-choice research found something specific worth flagging: scales that use the literal word "average" produce more top-heavy distributions than scales using "meets expectations" for the identical tier. Managers appear to treat the word "average" as something to avoid assigning even when it is accurate, which is a clean example of how label wording, not just tier count, shapes the data a scale produces.
How to Reduce Bias and Calibrate Ratings Across Managers
Calibration is the process of ensuring managers across an organization interpret and apply the rating scale the same way. Without it, a 4 from one manager and a 4 from another can represent meaningfully different performance levels, and the rating data becomes unusable for any decision spanning more than one team.
A working calibration session brings managers together, before or shortly after the review cycle closes, to walk through borderline cases together: each manager presents two or three ratings they are uncertain about, along with the supporting evidence, and the group aligns on whether the rating matches how the scale is being applied elsewhere. Calibration runs faster and surfaces real outliers when it is grounded in actual distribution data rather than anecdote, which is what makes a calibration view inside the same system used to run reviews more useful than a calibration meeting run off spreadsheets pulled together the week before.
- Train before the cycle opens, not after ratings are submitted. Bias training delivered after managers have already rated their teams cannot undo the ratings already locked in. Training needs to land before the rating window opens.
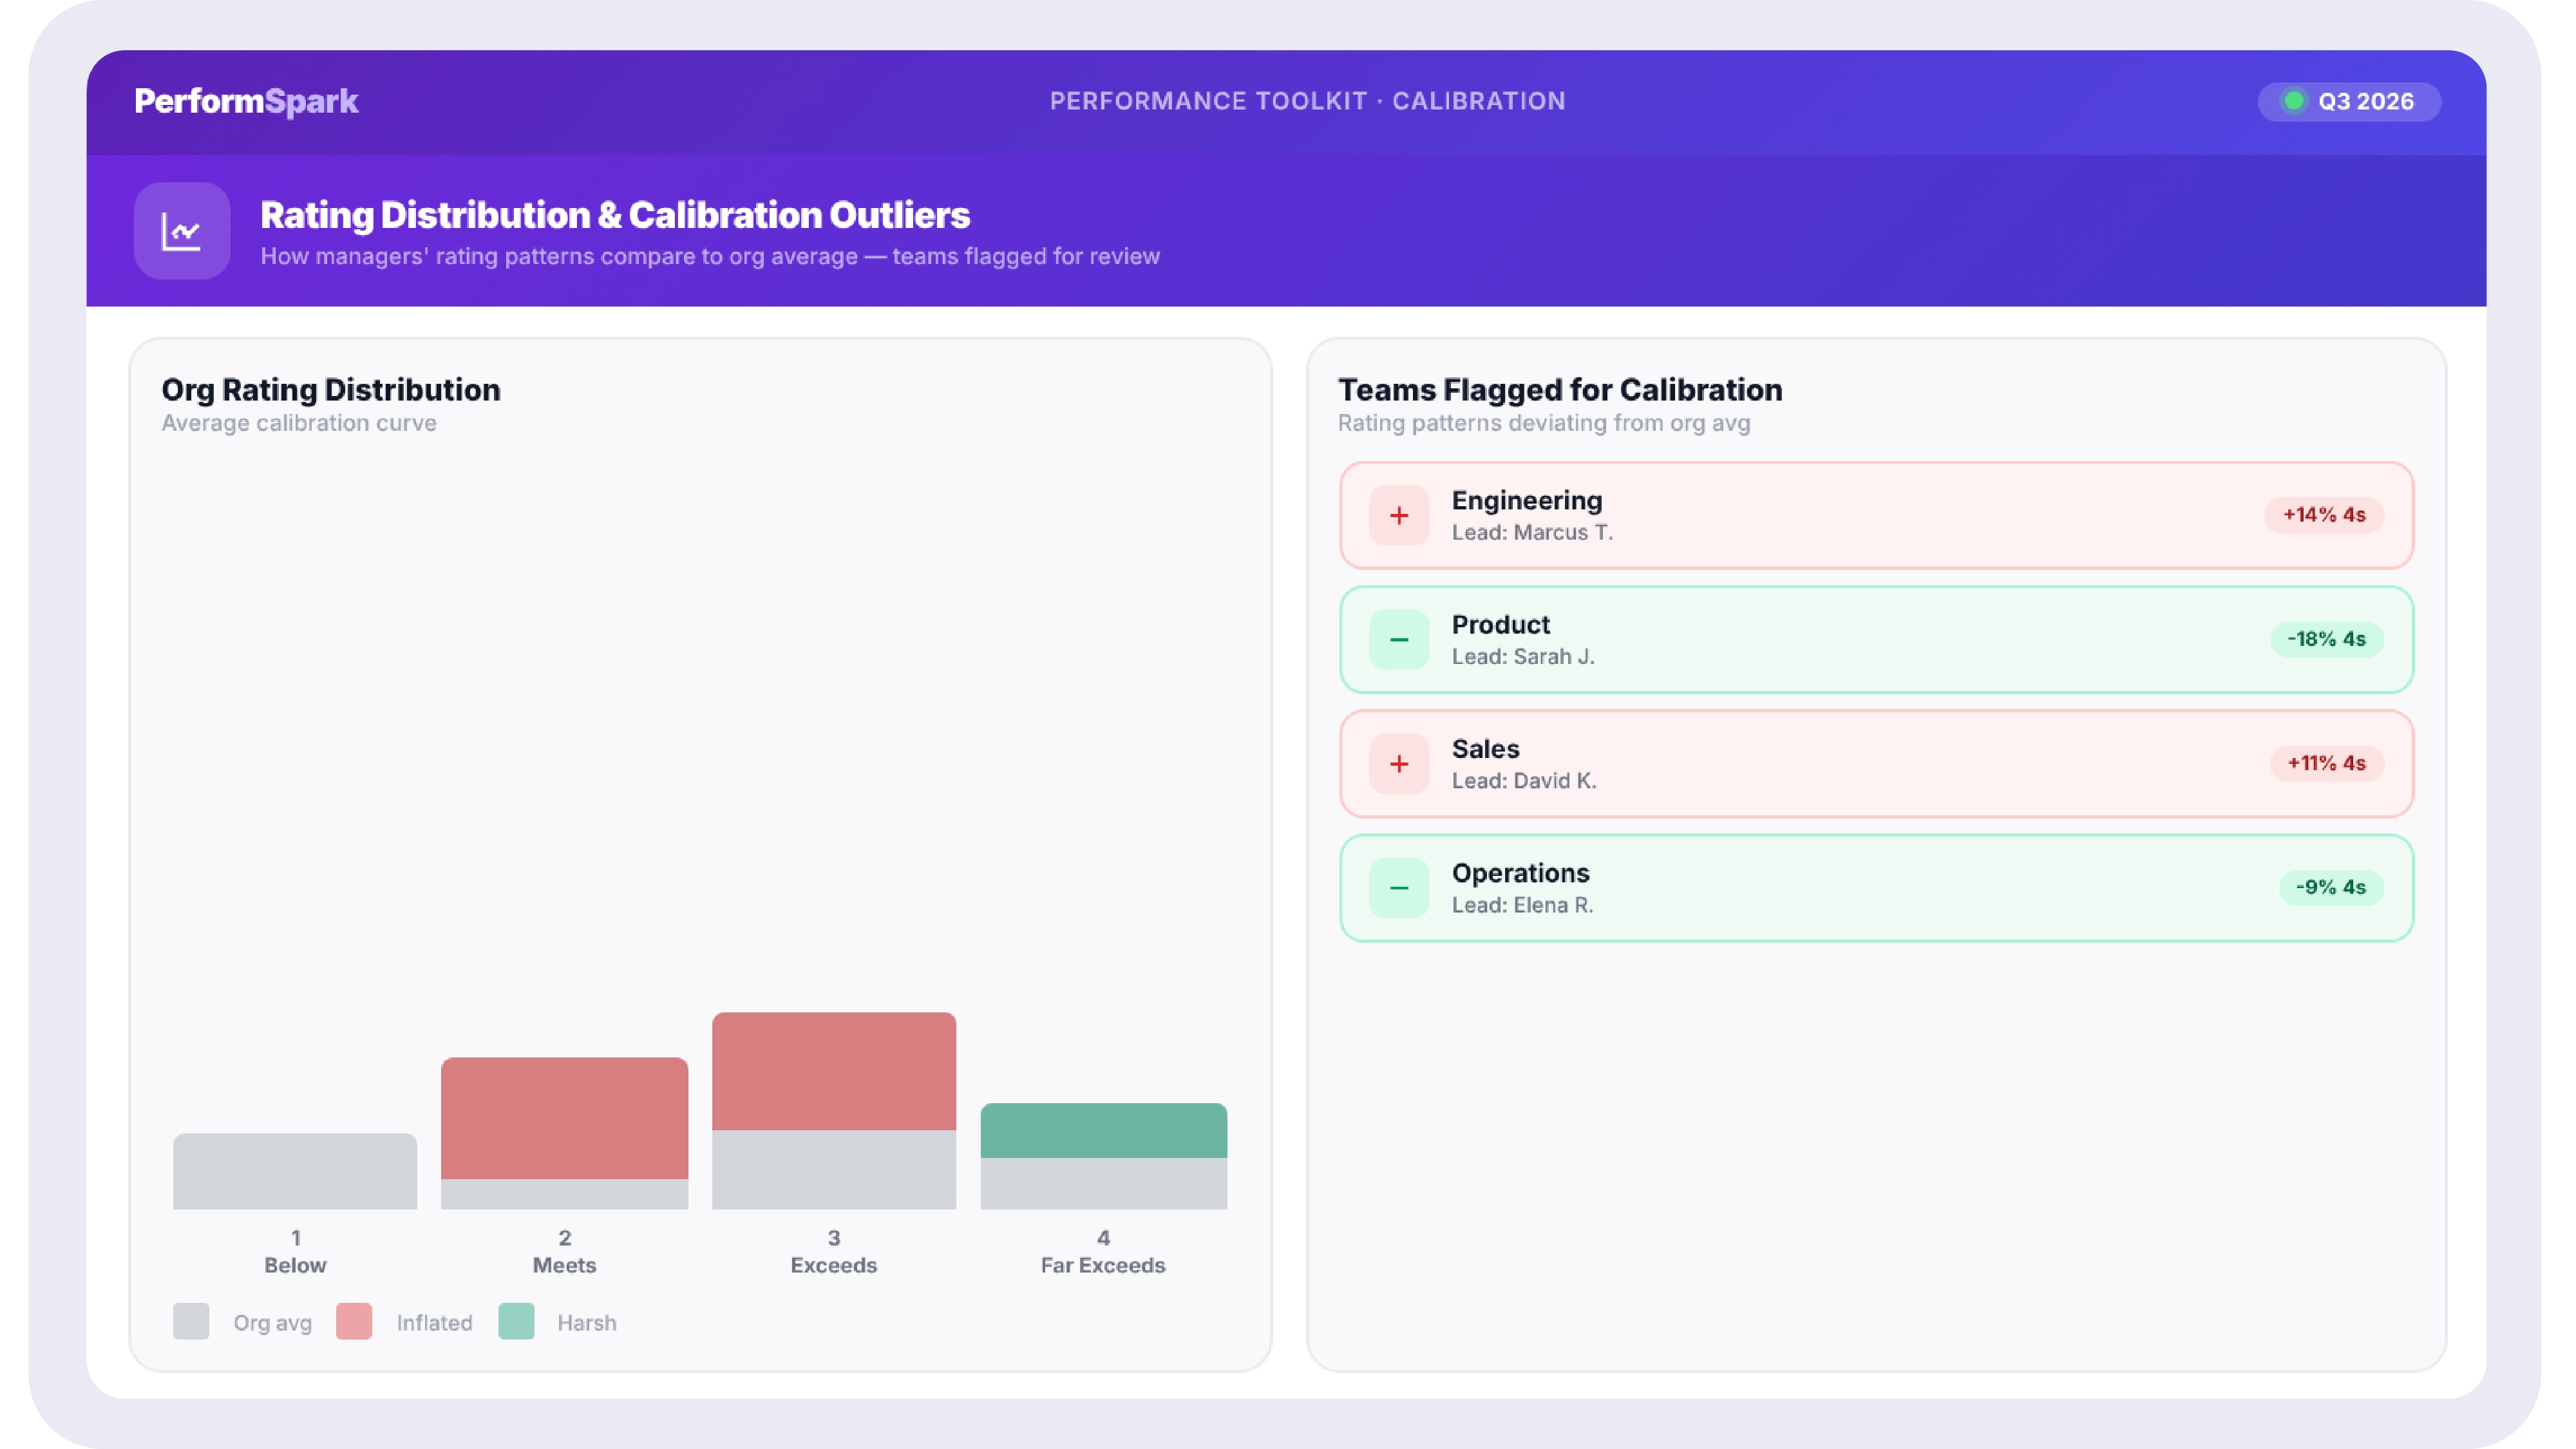
- Make distribution visible, not just individual scores. A manager who has never seen how their rating distribution compares to peers has no signal that they are clustering at the top or the middle.
- Do not force a distribution to fix bias. Forced rankings solve clustering by introducing a different distortion. The goal of calibration is consistency, not an artificially manufactured bell curve.
- Document the reasoning, not just the score. A rating with no supporting example is nearly impossible to calibrate against, since there is nothing concrete for other managers to compare it to.
How to Choose the Right Rating Scale for Your Organization
Four factors should drive the decision, in roughly this order of importance.
- Review maturity. Organizations running a structured review process for the first time should start with a 3-point or 4-point scale. BARS and other high-design-cost formats belong in year two or three, once the organization understands which behaviors actually distinguish performance levels.
- Calibration capacity. A scale only works if managers can apply it consistently. If the organization cannot realistically run calibration sessions, a simpler scale with fewer points is the safer choice regardless of how sophisticated a wider scale looks on paper.
- Purpose of the review. Development-focused reviews can tolerate more nuance and narrative. Compensation-linked ratings need clear, defensible distinctions that hold up when an employee asks why they received a lower score than a peer.
- Organization size. Under 100 employees, simple 3 to 4-point scales with informal calibration work well. From 100 to 500, a 5-point scale with clear written anchors and structured calibration becomes important. Above 500 employees, BARS or competency-anchored scales meaningfully reduce rating variance at scale.
Real Company Examples, Including a Cautionary One
Harvard University runs multiple scales within one system: overall performance on a five-point numerical scale, goal attainment on a three-point on-time and on-budget measure, and competencies on a separate four-point scale. The approach allows precision matched to what is actually being measured, at the cost of requiring strong manager training to keep three scales straight.
The University of California, Berkeley uses a five-level scale where any rating at the bottom two levels automatically triggers a formal improvement process, tying the scale directly to a process consequence rather than leaving a low rating undocumented and unactioned.
The cautionary example worth remembering comes from Microsoft’s own history. For years, the company ran a forced stack-ranking system that, as Bersin has written, fueled an intensely competitive culture during a period of rapid market dominance. The same system was widely reported to discourage internal collaboration, since helping a colleague could mathematically cost an employee their own ranking tier. Microsoft eventually abandoned the model. The lesson is not that rating scales are dangerous. It is that a scale’s incentive structure, not just its point count, determines whether it rewards the behavior an organization actually wants.
Connecting Rating Scales to Goal Attainment, Engagement, and Development
A rating scale that exists in isolation from the rest of an employee’s performance record loses most of its value. The strongest implementations connect three things to the same rating cycle.
Goal attainment should feed directly into the overall rating rather than sitting in a separate system a manager has to cross-reference manually. When OKR software for HR teams and the performance review scale live in the same record, a manager scoring overall performance can see actual goal completion data instead of relying on memory of what was promised at the start of the cycle.
Engagement and fairness perception are downstream of how the rating process is run, not just the score itself, which is exactly what Culture Amp's own fairness research demonstrated. Tracking employee engagement alongside rating data over time shows whether a scale redesign actually improved trust or just changed the numbers on paper.
Ratings should also surface in the conversations that happen between formal cycles, not just at review time. Structured one-on-one meetings for manager coaching are where a rating actually gets explained, contextualized, and turned into a development plan, and a rating that only appears once a year inside a form disconnects the score from the coaching that should follow it.
Common Mistakes That Make Any Rating Scale Fail
- Choosing complexity for its own sake. A BARS scale that 60 percent of managers misinterpret produces worse data than a clearly applied 3-point scale. Sophistication only helps if the manager group can actually use it consistently.
- Changing the scale every cycle. Revising the scale annually resets the learning curve for every manager and destroys year-over-year comparability, which is often the entire point of having a scale.
- Letting score and written feedback contradict each other. A 4 out of 5 paired with comments describing significant struggles destroys the credibility of both the score and the manager who gave it.
- Using one scale across fundamentally different roles. A BARS scale built for a customer-facing competency rarely translates cleanly to an engineering role. Behavioral anchors need to be role-relevant or they collapse into generic language that defeats the purpose.
- Skipping calibration to save time. Calibration is the single highest-leverage activity for rating quality. Skipping it to move faster through a review cycle is the most common reason a well-designed scale still produces inconsistent data.
The debate over which rating scale is best misses the actual lever. Bersin’s decade of research on this exact question concluded that ratings were never the core issue; the quality of the data behind them and the consistency of how managers apply them is what determines whether a scale builds trust or erodes it. A 4-point and a 5-point scale, used with real calibration and connected to goals, development, and engagement data, will consistently outperform a more sophisticated scale applied inconsistently.
Choosing the right format starts with an honest read of your organization’s review maturity and calibration capacity, not with which scale looks most sophisticated on a comparison chart. Get those two factors right, and the specific point count becomes a much smaller decision than most buying guides make it out to be.
Research Methodology & References
To ensure accuracy, this article draws on peer-reviewed research, industry benchmark studies, and HR thought leadership publications, including:
- Josh Bersin performance management research
- Deloitte High-Impact Performance Management studies
- Culture Amp workforce analytics research
- Personnel Psychology research on performance evaluation bias
- Journal of Applied Psychology studies on rating accuracy and rater effects
Key Takeaways
- 4-point and 5-point scales dominate real-world usage. Culture Amp’s own analysis of over 462,000 employees found 52 percent of companies use a 4-point scale and 31 percent use a 5-point scale.
- Rating scales are not the underlying problem. Industry analyst Josh Bersin has argued that organizations inherently need to make evaluative decisions about people, and the real lever is using better data and applying it transparently, not abandoning ratings altogether.
- Close to half the variation in performance ratings comes from the manager doing the rating, not the employee being rated, which is why calibration matters as much as scale design.
- The word choices inside a scale change the data. Scales using the term "average" cluster ratings toward the top, since managers avoid labeling someone average even when that is accurate.
- A rating scale should connect to goal attainment, development planning, and engagement data, not function as an isolated form field disconnected from the rest of the performance record.
Rating scales have a credibility problem that predates almost every HR team currently dealing with one. Employees distrust them. Managers cluster everyone in the middle to avoid hard conversations. HR inherits a scale from a prior director or an HRIS default and never revisits whether it actually measures anything. And yet the alternative, no structured rating at all, leaves compensation, promotion, and succession decisions without any defensible basis.
Industry analyst Josh Bersin has spent two decades studying this exact tension. After a decade of organizations debating whether to abandon ratings, his conclusion was direct: ratings themselves were never the core issue. Organizations inherently need to make evaluative decisions about people: who gets promoted, who gets more pay, who needs a different role, and those decisions are evaluative by nature whether or not a number is attached. The real lever, in his framing, is whether the data behind the decision is good, the process is transparent, and managers apply the scale consistently.
This guide covers every major rating scale type in use today, the specific biases that distort ratings regardless of scale design, a practical calibration process, and a decision framework for choosing the right scale for your organization’s size and maturity. It also covers what most competing guides skip: how the rating scale should connect to goal attainment, development planning, and engagement, rather than functioning as an isolated form field.
What Is a Performance Review Rating Scale?
A performance review rating scale is a standardized system for scoring employee performance during formal evaluation periods, converting a manager’s qualitative judgment into structured, comparable data. It provides a consistent measure across individuals, teams, and review cycles that HR and leadership can use for compensation decisions, promotion readiness, succession planning, and development tracking. Scales serve two functions at once: they structure the review conversation itself, and they produce the data record that decisions get built on. A scale that managers cannot apply consistently fails at both.
Why Rating Scales Still Matter
In Deloitte’s Bersin research on high-impact performance management, the process was found to be widely unpopular among employees, with a measured net promoter score around negative 60, yet 96 percent of companies still conduct formal performance reviews and 86 percent still use some form of rating. That gap, between how disliked the process is and how universally it persists, is the strongest evidence that ratings solve a real organizational need even when poorly executed.
Culture Amp’s own research adds a second, more direct reason ratings matter: how an employee is rated shapes how they experience fairness and growth at work. Their analysis found employees who feel their performance was evaluated fairly report meaningfully higher engagement, while employees who strongly disagree that their evaluation was fair are far more likely to leave within the following year. The rating itself becomes a trust signal, independent of the score.
Practitioner Insight: HR teams sometimes treat the rating scale as the entire performance management decision, debating 4-point versus 5-point for months while the actual driver of fair outcomes, whether managers received real calibration training, gets a single slide in a rollout deck. The scale matters less than whether two managers rating the same employee profile would land on the same score.
Types of Performance Review Rating Scales
No competing guide covers the full range of scale types in one place. Here is every major format in current use, what it looks like, and where it fits.
3-Point Scale
A three-tier system, typically "Does Not Meet Expectations," "Meets Expectations," and "Exceeds Expectations." Best for organizations running their first structured review cycle or small manager groups where informal calibration is realistic. The tradeoff is that most employees land in the middle tier, and the scale struggles to differentiate solid performers from genuinely exceptional ones.
4-Point Scale
A four-tier system that deliberately removes the neutral middle option, often "Needs Development," "Meets Expectations," "Exceeds Expectations," and "Sets a New Standard." This is the most widely used scale in real-world practice. Removing the midpoint forces a directional decision and reduces central tendency clustering, at the cost of requiring sharper definitions between adjacent tiers.
5-Point Numerical and Descriptive Scales
The most familiar format: a 1 to 5 score, either numeric only or paired with anchor labels at each point. Best for mid-market organizations tying ratings to compensation bands. The well-documented risk is central tendency bias, scores clustering at 3, which without calibration can effectively collapse a five-point scale into a three-point scale in practice.
7-Point and 10-Point Scales
Wider scales offer finer differentiation, useful for organizations doing detailed performance analytics or research-driven workforce planning. The tradeoff grows sharply with scale width: managers and employees alike struggle to articulate what genuinely separates a 7 from an 8, and inter-rater consistency tends to degrade as the number of points increases without proportionally more training investment.
Behaviorally Anchored Rating Scale (BARS)
Each point on a BARS scale is defined by a specific, observable behavior tied to the role rather than a generic descriptor. A BARS entry for a customer-facing competency might define a top rating as proactively resolving issues before a client raises them, and a bottom rating as ignoring or mishandling complaints. BARS produces the most consistent ratings of any format because raters compare actual behavior to a written example instead of interpreting an abstract label, but it requires significant upfront design work per role and ongoing maintenance as roles evolve.
Likert Scales
A symmetric agreement scale, typically "Strongly Disagree" to "Strongly Agree," used to rate agreement with a specific statement. Likert scales fit engagement surveys and 360-degree feedback instruments well but are a weaker primary instrument for individual output-focused performance reviews, since agreement with a general statement is a different measurement task than scoring delivered output.
Graphic and Custom Scales
A graphic scale presents a sliding visual bar rather than discrete tiers, intuitive to use but carrying the same bias risks as any other format if used without written feedback alongside it. A custom scale replaces generic labels with language specific to a company’s values or competency framework. Custom scales increase relevance and buy-in but make cross-department calibration harder, since the meaning of each tier has to be taught rather than assumed.
4-Point vs 5-Point Rating Scale: Which Is More Common?
According to Culture Amp’s analysis of standardized rating data across more than 462,000 employees and over 1,500 companies, 52 percent of organizations use a 4-point scale and 31 percent use a 5-point scale, making these two formats the practical default for most mid-market and enterprise reviews. The choice between them is less about which is objectively better and more about whether removing the neutral midpoint, the core difference between a typical 4-point and 5-point design, fits a culture’s tolerance for forced directional ratings.
The Most Common Rating Scale Biases
Two researchers cited by Bersin, drawing on studies published in Personnel Psychology and the Journal of Applied Psychology, found that close to half the variation in performance ratings is explained by which manager is doing the rating, not by the employee’s actual performance. Scale design alone cannot fix that. The specific biases below are what produce it.
- Central tendency bias. Managers default to the middle rating to avoid conflict or appear fair, flattening real performance differences and reducing a five-point scale to a de facto three-point scale in practice.
- Leniency bias. Managers rate consistently higher than performance warrants, often to stay popular or avoid a difficult conversation, leading to rating inflation that makes top performers indistinguishable from solid ones.
- Recency bias. Only the last few weeks before the review get weighted, while the first months of the cycle are effectively forgotten, disadvantaging employees who were strong early but had a rough final stretch.
- Halo and horn effects. One standout positive trait, or one notable failure, colors every other rating dimension regardless of actual performance in those specific areas.
- Similarity bias. Managers rate employees who share their own background, communication style, or working approach more favorably, which compounds into measurable inequity at scale.
- Contrast effect. A rating is unconsciously anchored against the immediately preceding review. An average performer reviewed right after a weak one can appear stronger than they actually are, and vice versa.
Practitioner Insight: Culture Amp’s own word-choice research found something specific worth flagging: scales that use the literal word "average" produce more top-heavy distributions than scales using "meets expectations" for the identical tier. Managers appear to treat the word "average" as something to avoid assigning even when it is accurate, which is a clean example of how label wording, not just tier count, shapes the data a scale produces.
How to Reduce Bias and Calibrate Ratings Across Managers
Calibration is the process of ensuring managers across an organization interpret and apply the rating scale the same way. Without it, a 4 from one manager and a 4 from another can represent meaningfully different performance levels, and the rating data becomes unusable for any decision spanning more than one team.
A working calibration session brings managers together, before or shortly after the review cycle closes, to walk through borderline cases together: each manager presents two or three ratings they are uncertain about, along with the supporting evidence, and the group aligns on whether the rating matches how the scale is being applied elsewhere. Calibration runs faster and surfaces real outliers when it is grounded in actual distribution data rather than anecdote, which is what makes a calibration view inside the same system used to run reviews more useful than a calibration meeting run off spreadsheets pulled together the week before.
- Train before the cycle opens, not after ratings are submitted. Bias training delivered after managers have already rated their teams cannot undo the ratings already locked in. Training needs to land before the rating window opens.
- Make distribution visible, not just individual scores. A manager who has never seen how their rating distribution compares to peers has no signal that they are clustering at the top or the middle.
- Do not force a distribution to fix bias. Forced rankings solve clustering by introducing a different distortion. The goal of calibration is consistency, not an artificially manufactured bell curve.
- Document the reasoning, not just the score. A rating with no supporting example is nearly impossible to calibrate against, since there is nothing concrete for other managers to compare it to.
How to Choose the Right Rating Scale for Your Organization
Four factors should drive the decision, in roughly this order of importance.
- Review maturity. Organizations running a structured review process for the first time should start with a 3-point or 4-point scale. BARS and other high-design-cost formats belong in year two or three, once the organization understands which behaviors actually distinguish performance levels.
- Calibration capacity. A scale only works if managers can apply it consistently. If the organization cannot realistically run calibration sessions, a simpler scale with fewer points is the safer choice regardless of how sophisticated a wider scale looks on paper.
- Purpose of the review. Development-focused reviews can tolerate more nuance and narrative. Compensation-linked ratings need clear, defensible distinctions that hold up when an employee asks why they received a lower score than a peer.
- Organization size. Under 100 employees, simple 3 to 4-point scales with informal calibration work well. From 100 to 500, a 5-point scale with clear written anchors and structured calibration becomes important. Above 500 employees, BARS or competency-anchored scales meaningfully reduce rating variance at scale.
Real Company Examples, Including a Cautionary One
Harvard University runs multiple scales within one system: overall performance on a five-point numerical scale, goal attainment on a three-point on-time and on-budget measure, and competencies on a separate four-point scale. The approach allows precision matched to what is actually being measured, at the cost of requiring strong manager training to keep three scales straight.
The University of California, Berkeley uses a five-level scale where any rating at the bottom two levels automatically triggers a formal improvement process, tying the scale directly to a process consequence rather than leaving a low rating undocumented and unactioned.
The cautionary example worth remembering comes from Microsoft’s own history. For years, the company ran a forced stack-ranking system that, as Bersin has written, fueled an intensely competitive culture during a period of rapid market dominance. The same system was widely reported to discourage internal collaboration, since helping a colleague could mathematically cost an employee their own ranking tier. Microsoft eventually abandoned the model. The lesson is not that rating scales are dangerous. It is that a scale’s incentive structure, not just its point count, determines whether it rewards the behavior an organization actually wants.
Connecting Rating Scales to Goal Attainment, Engagement, and Development
A rating scale that exists in isolation from the rest of an employee’s performance record loses most of its value. The strongest implementations connect three things to the same rating cycle.
Goal attainment should feed directly into the overall rating rather than sitting in a separate system a manager has to cross-reference manually. When OKR software for HR teams and the performance review scale live in the same record, a manager scoring overall performance can see actual goal completion data instead of relying on memory of what was promised at the start of the cycle.
Engagement and fairness perception are downstream of how the rating process is run, not just the score itself, which is exactly what Culture Amp's own fairness research demonstrated. Tracking employee engagement alongside rating data over time shows whether a scale redesign actually improved trust or just changed the numbers on paper.
Ratings should also surface in the conversations that happen between formal cycles, not just at review time. Structured one-on-one meetings for manager coaching are where a rating actually gets explained, contextualized, and turned into a development plan, and a rating that only appears once a year inside a form disconnects the score from the coaching that should follow it.
Common Mistakes That Make Any Rating Scale Fail
- Choosing complexity for its own sake. A BARS scale that 60 percent of managers misinterpret produces worse data than a clearly applied 3-point scale. Sophistication only helps if the manager group can actually use it consistently.
- Changing the scale every cycle. Revising the scale annually resets the learning curve for every manager and destroys year-over-year comparability, which is often the entire point of having a scale.
- Letting score and written feedback contradict each other. A 4 out of 5 paired with comments describing significant struggles destroys the credibility of both the score and the manager who gave it.
- Using one scale across fundamentally different roles. A BARS scale built for a customer-facing competency rarely translates cleanly to an engineering role. Behavioral anchors need to be role-relevant or they collapse into generic language that defeats the purpose.
- Skipping calibration to save time. Calibration is the single highest-leverage activity for rating quality. Skipping it to move faster through a review cycle is the most common reason a well-designed scale still produces inconsistent data.
The debate over which rating scale is best misses the actual lever. Bersin’s decade of research on this exact question concluded that ratings were never the core issue; the quality of the data behind them and the consistency of how managers apply them is what determines whether a scale builds trust or erodes it. A 4-point and a 5-point scale, used with real calibration and connected to goals, development, and engagement data, will consistently outperform a more sophisticated scale applied inconsistently.
Choosing the right format starts with an honest read of your organization’s review maturity and calibration capacity, not with which scale looks most sophisticated on a comparison chart. Get those two factors right, and the specific point count becomes a much smaller decision than most buying guides make it out to be.
Research Methodology & References
To ensure accuracy, this article draws on peer-reviewed research, industry benchmark studies, and HR thought leadership publications, including:
- Josh Bersin performance management research
- Deloitte High-Impact Performance Management studies
- Culture Amp workforce analytics research
- Personnel Psychology research on performance evaluation bias
- Journal of Applied Psychology studies on rating accuracy and rater effects
.webp)
.webp)


.svg)

.svg)
.svg)

