
Table of Contents
Most HR teams can describe what disengagement looks like long before they can prove it. A team that used to volunteer for stretch projects has gone quiet. Goal completion has slipped from 90 percent to 60 percent over two quarters. Manager 1:1s get rescheduled, then skipped. None of this shows up on a dashboard until someone runs the annual engagement survey, and by then, the best people have often already updated their resumes.
Employee engagement is not a soft metric. It is a leading indicator of turnover, productivity, and customer outcomes, and it is measurable with the same rigor HR teams apply to compensation or headcount planning. The problem is not a lack of survey tools. Most organizations already run an annual engagement survey, and many have added pulse surveys on top of it. The problem is that survey data alone tells you how people feel without telling you whether that feeling is showing up in their actual work.
This guide defines employee engagement precisely, separates it from the adjacent concepts it gets confused with, and walks through the specific methods, formulas, and metrics used to measure it. It also covers where most measurement programs break down and how connecting engagement data to performance management data closes the gap between knowing engagement dropped and knowing why.
What Is Employee Engagement?
Employee engagement is the degree to which an employee feels emotionally invested in their work and is willing to put in discretionary effort beyond their minimum job requirements. It captures three connected dimensions: cognitive engagement (belief in the organization's direction), emotional engagement (a sense of connection to the team and the work itself), and behavioral engagement (the extra effort an employee chooses to apply when no one is checking).
The concept originated in organizational psychology research in the 1990s and has since become a standard HR metric because it correlates strongly with retention, productivity, and customer satisfaction. An engaged employee does not just complete their tasks. They proactively flag problems, mentor newer colleagues, and stay through difficult stretches that would push a disengaged employee to start interviewing elsewhere.
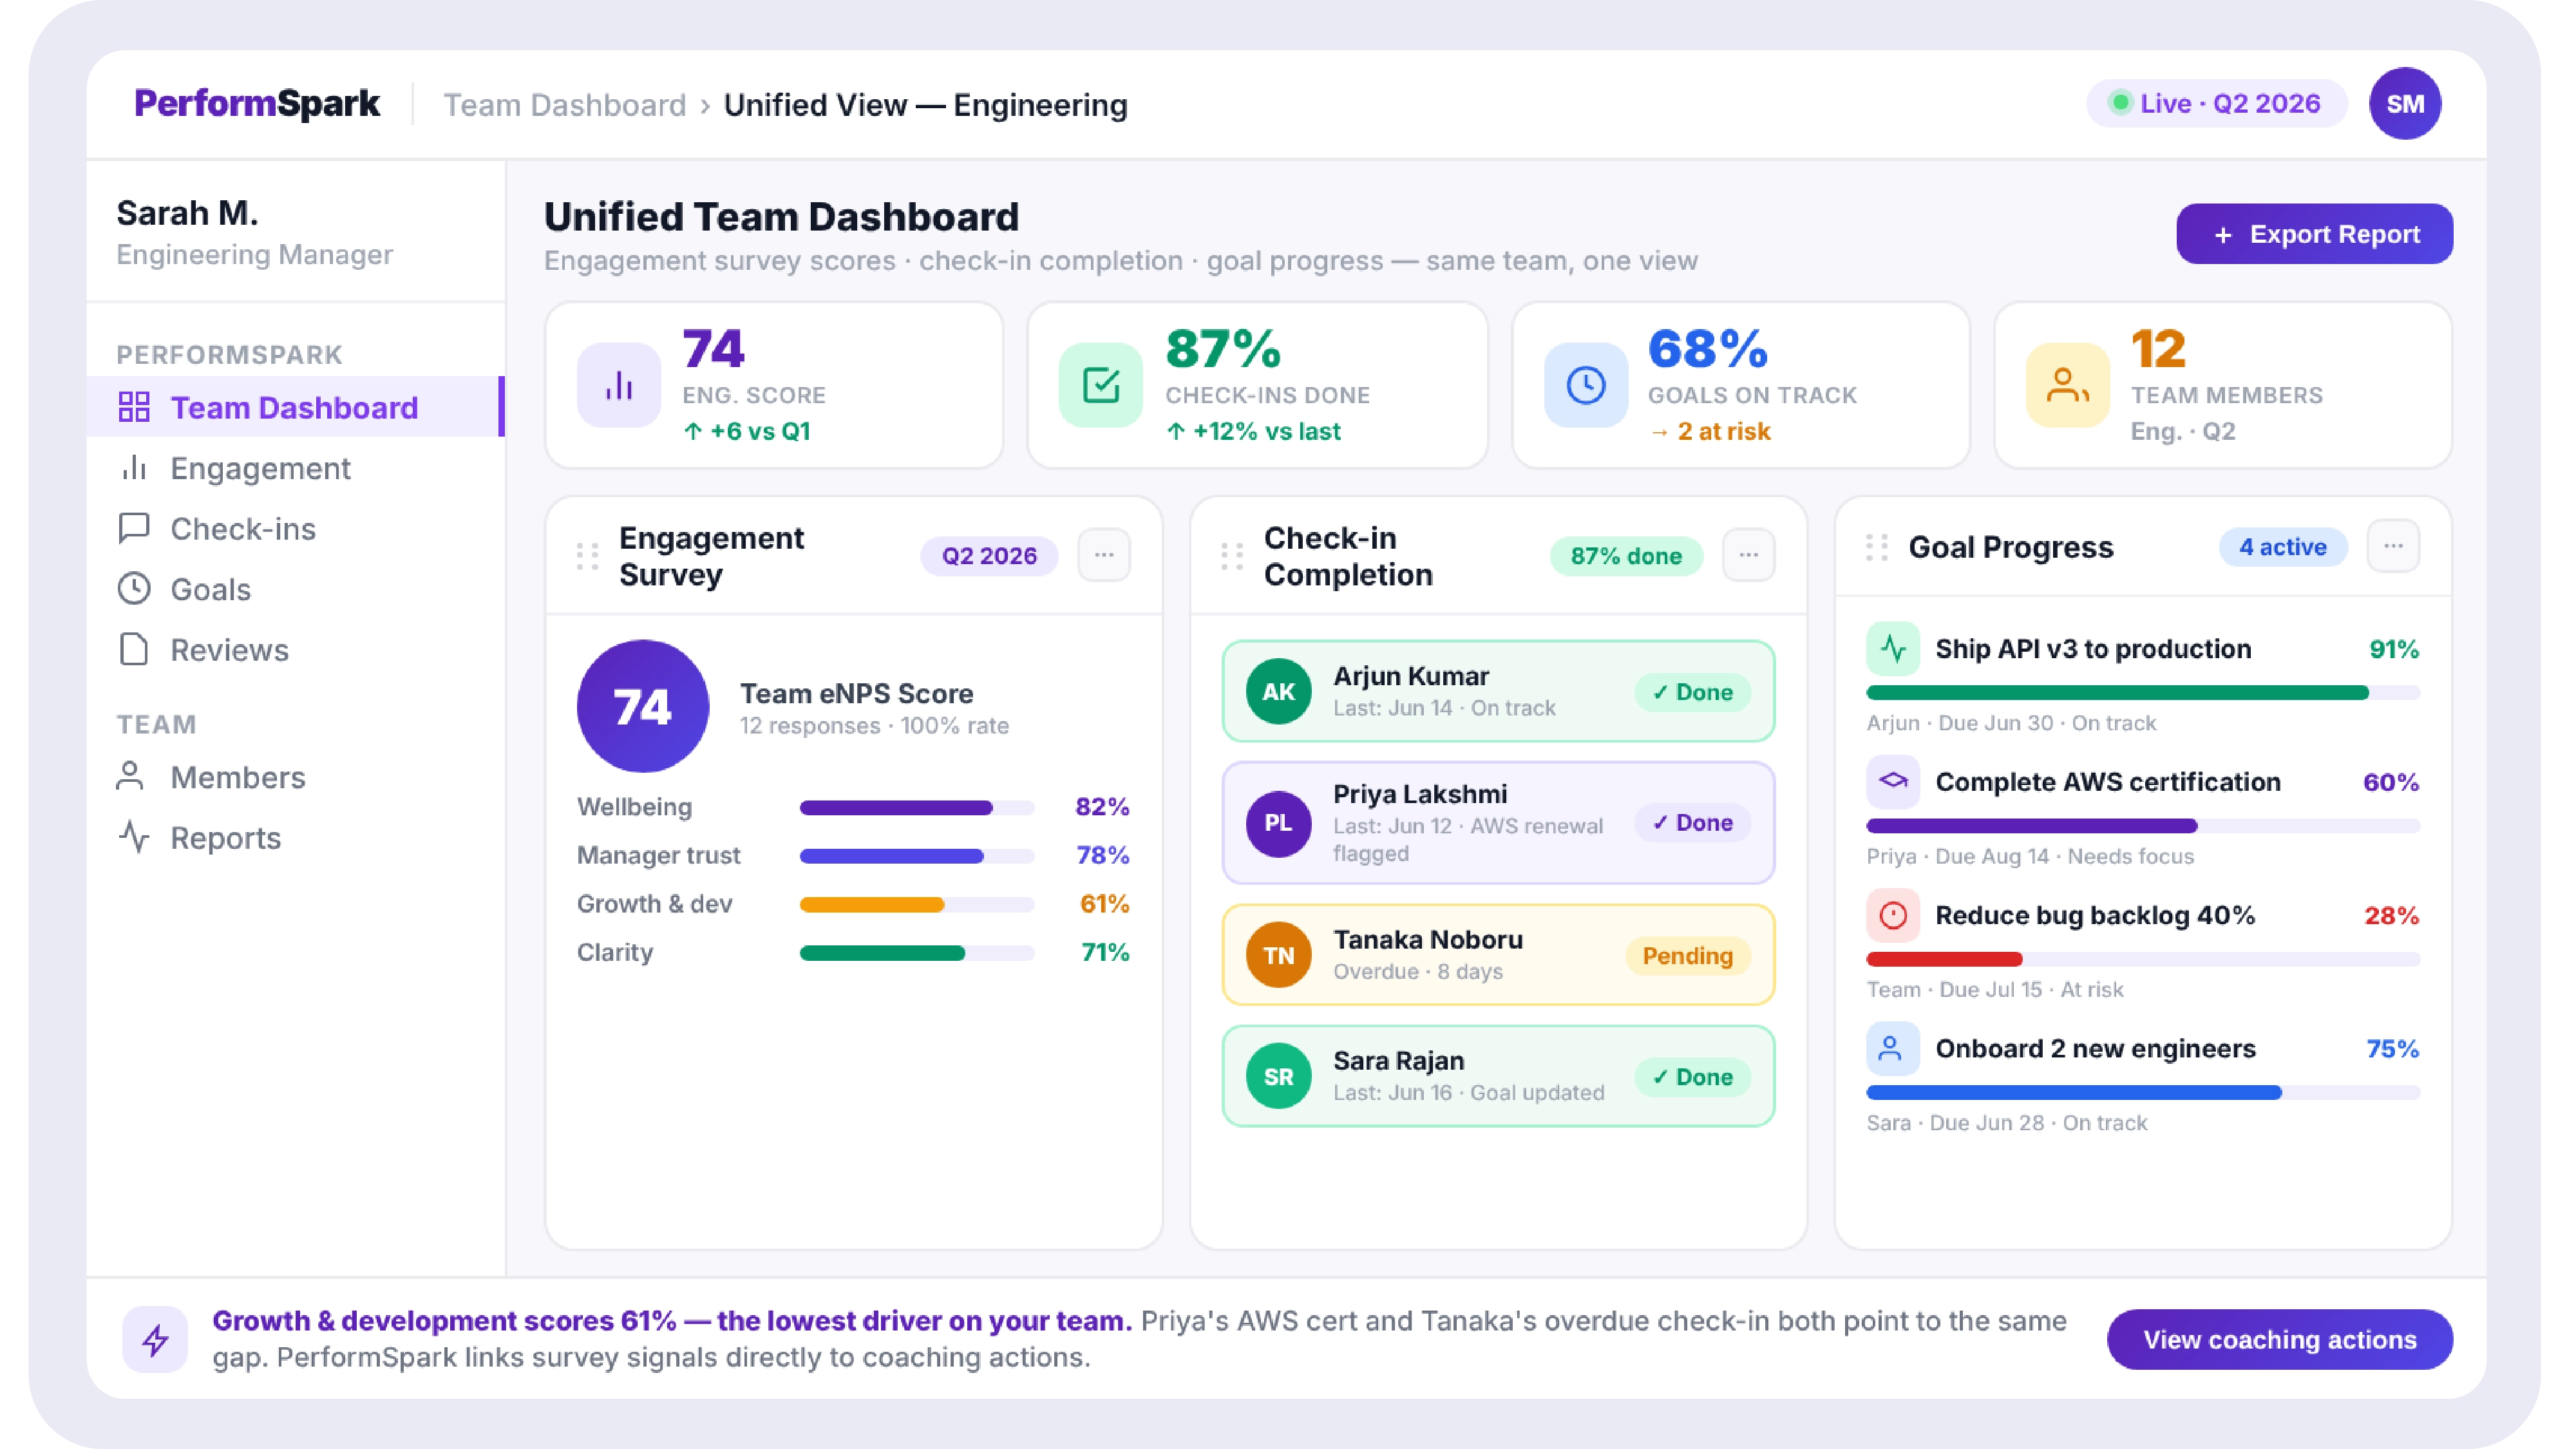
Practitioner Insight: HR leaders often run an annual engagement survey and report the topline score to leadership, but cannot answer the next question: which teams are actually at risk right now. The fix is not a better survey question. It is pairing survey sentiment with the behavioral data already sitting in the performance system, so a dropping engagement score on a team also shows up as fewer completed check-ins and stalled goals for that same team, weeks before the next survey cycle.
Why Measuring Employee Engagement Matters Now
Organizations with consistently high engagement scores see measurably lower voluntary turnover, higher goal completion rates, and stronger internal promotion pipelines compared to organizations that treat engagement as a once-a-year survey exercise. The business case has three parts.
- Retention cost avoidance. Replacing a mid-level employee typically costs six to nine months of their salary in recruiting, onboarding, and lost productivity. Catching disengagement early through behavioral signals gives managers time to intervene before resignation, not after.
- Productivity and goal velocity. Engaged employees complete a higher percentage of their assigned goals on schedule. When goal completion rates drop across a team without a corresponding change in workload, that is frequently an engagement signal arriving before the survey data does.
- Manager accountability. Engagement is not evenly distributed. It is heavily influenced by manager effectiveness , since direct managers control most of the day-to-day drivers: recognition, role clarity, and check-in consistency. Measuring engagement at the team level, not just the company level, is what makes the data actionable for manager coaching rather than just an HR talking point.
Employee Engagement vs Employee Satisfaction vs Employee Experience
These three terms get used interchangeably in casual HR conversations, but they measure different things and require different survey instruments. Conflating them is one of the most common reasons engagement programs produce confusing or contradictory results.
A useful distinction practitioners use: satisfaction is about whether the job is good enough to stay in, while engagement is about whether the employee wants to go above and beyond while they are there. An employee can be satisfied with their pay and schedule while being fully disengaged from the actual work, which is exactly why satisfaction scores alone are a poor proxy for engagement. Systems that already track recognition, such as employee recognition software, often surface that gap before a survey does.
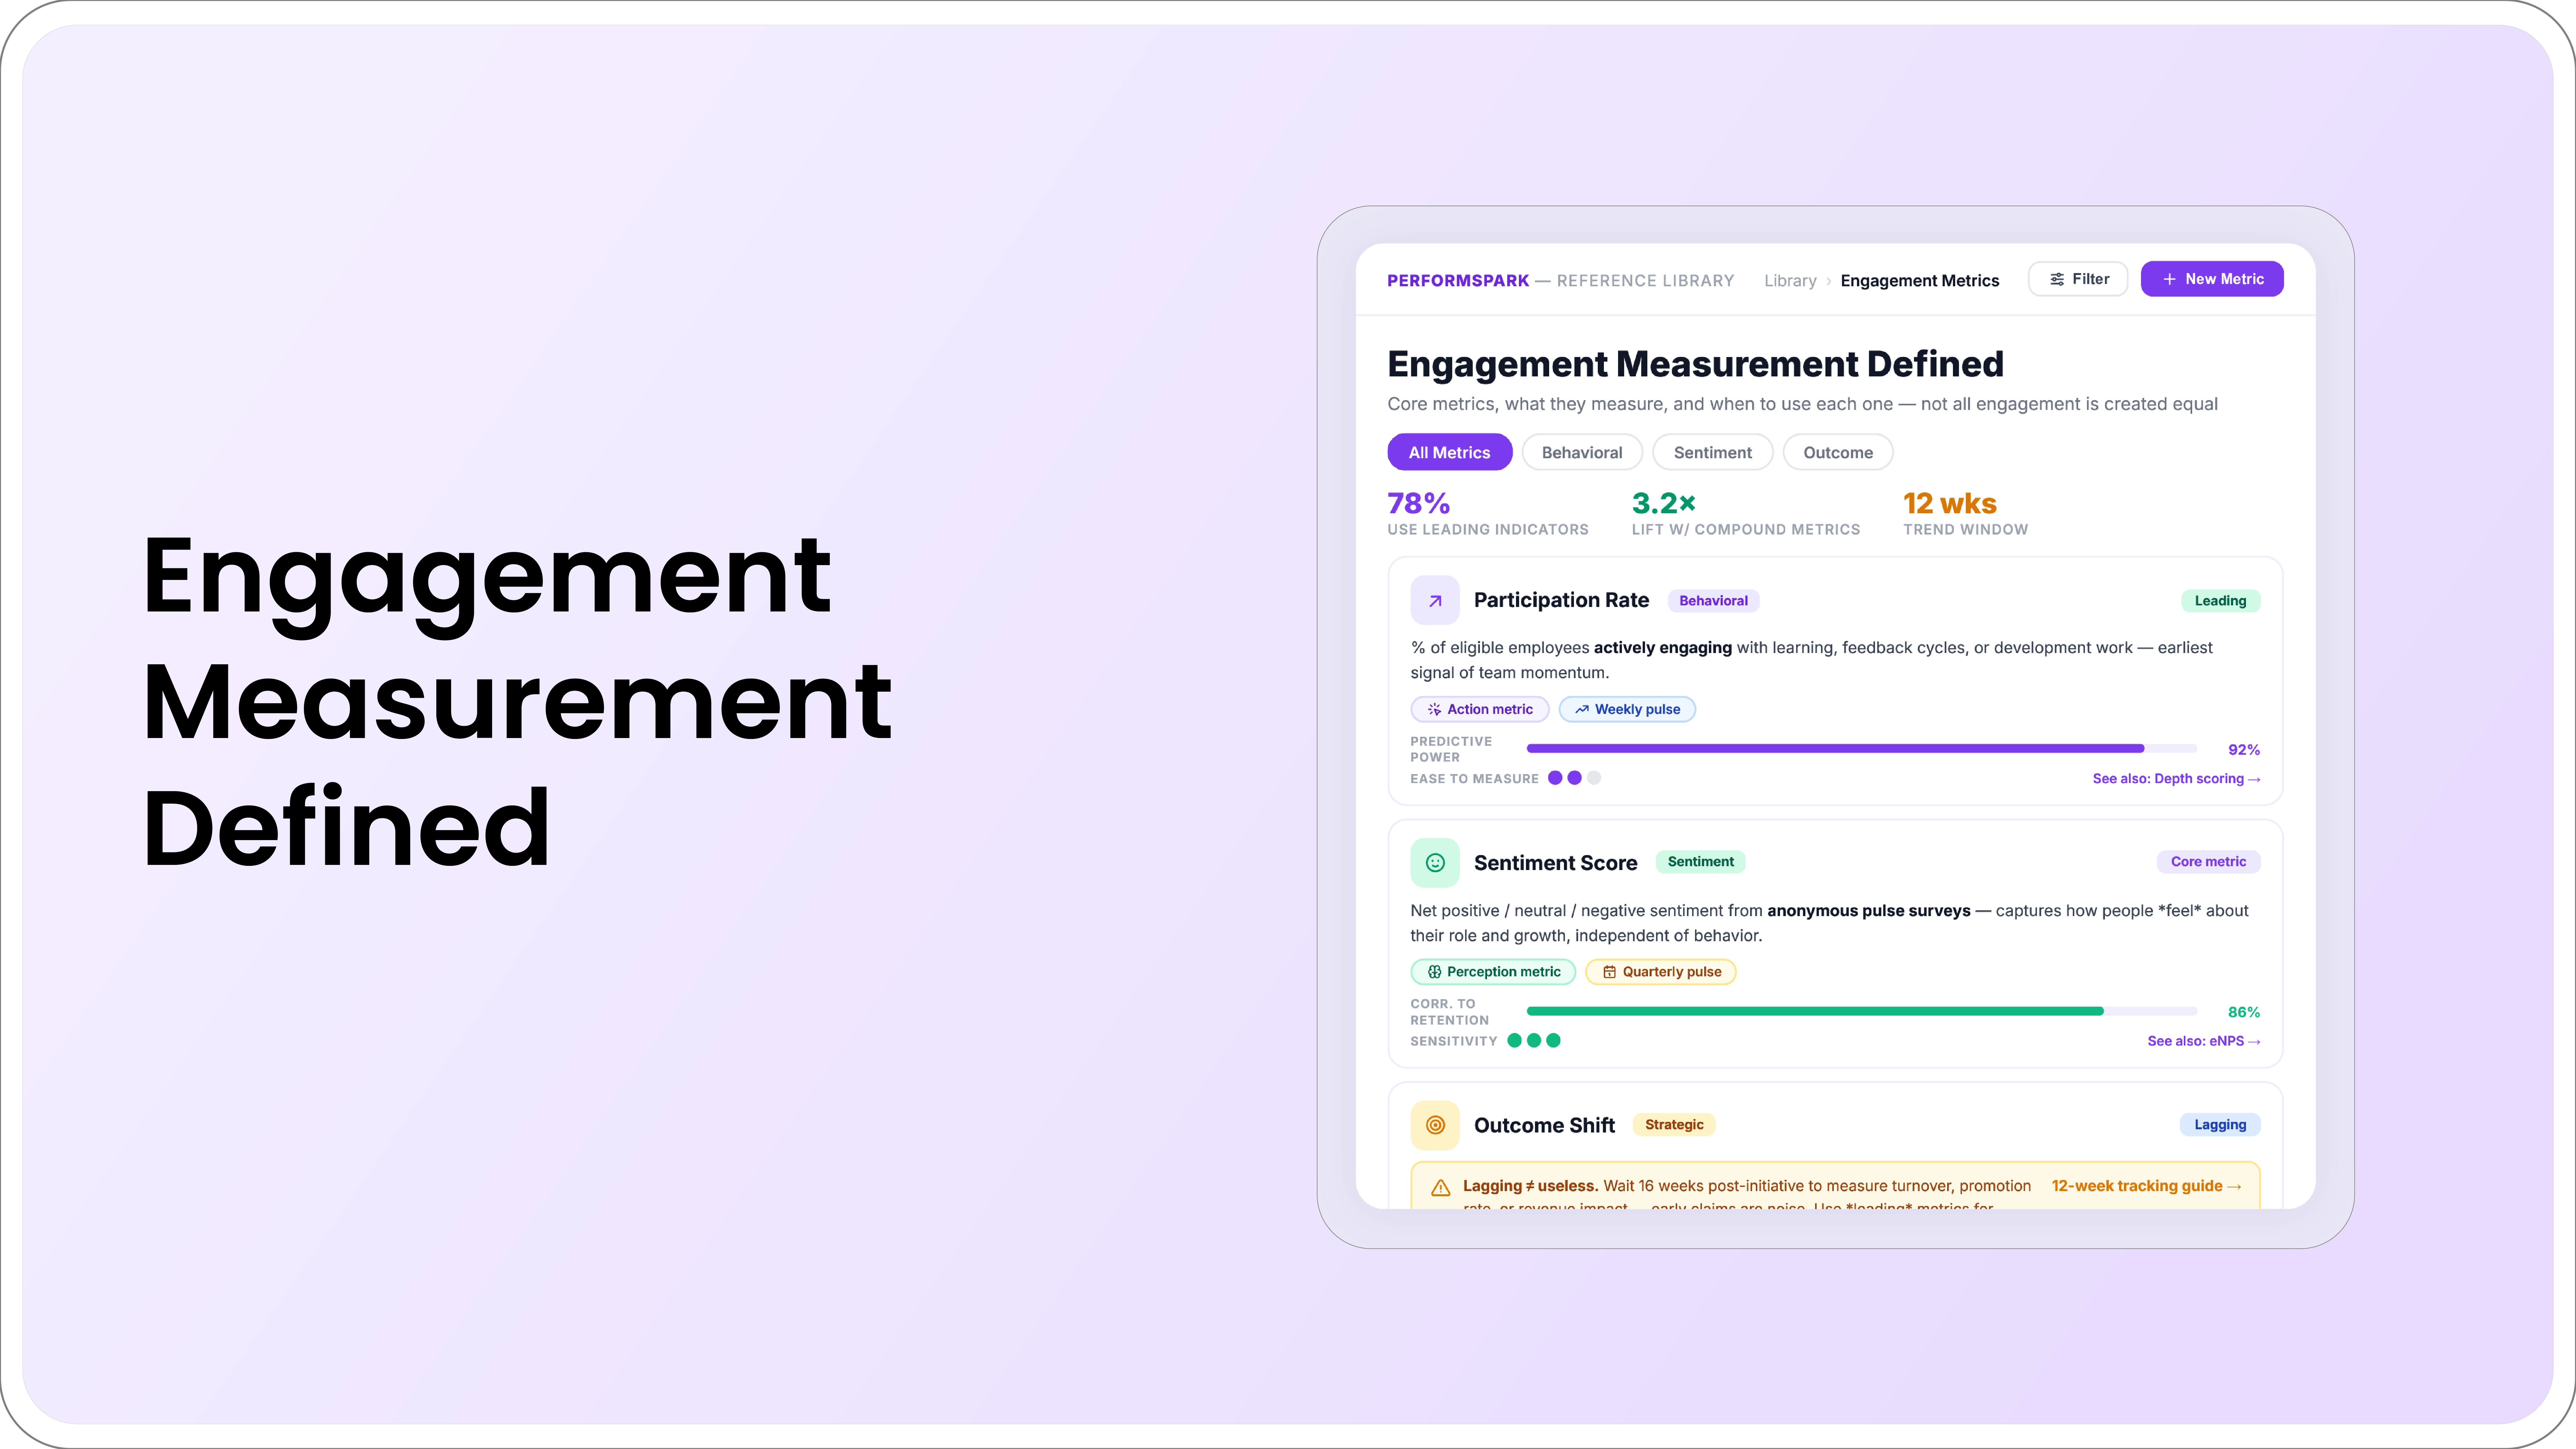
Core Methods for Measuring Employee Engagement
No single method captures engagement completely. The methods below work as layers, with surveys capturing stated sentiment and behavioral data capturing whether that sentiment translates into action.
1. Annual Engagement Surveys
A comprehensive is survey distributed once or twice a year, typically with 40 to 60 questions covering core drivers: purpose, manager support, growth opportunity, recognition, and workplace conditions. Annual surveys provide a statistically reliable baseline and a year-over-year benchmark, but the 12-month gap between data points means problems can develop and resolve, or develop and cause a resignation, entirely between survey cycles.
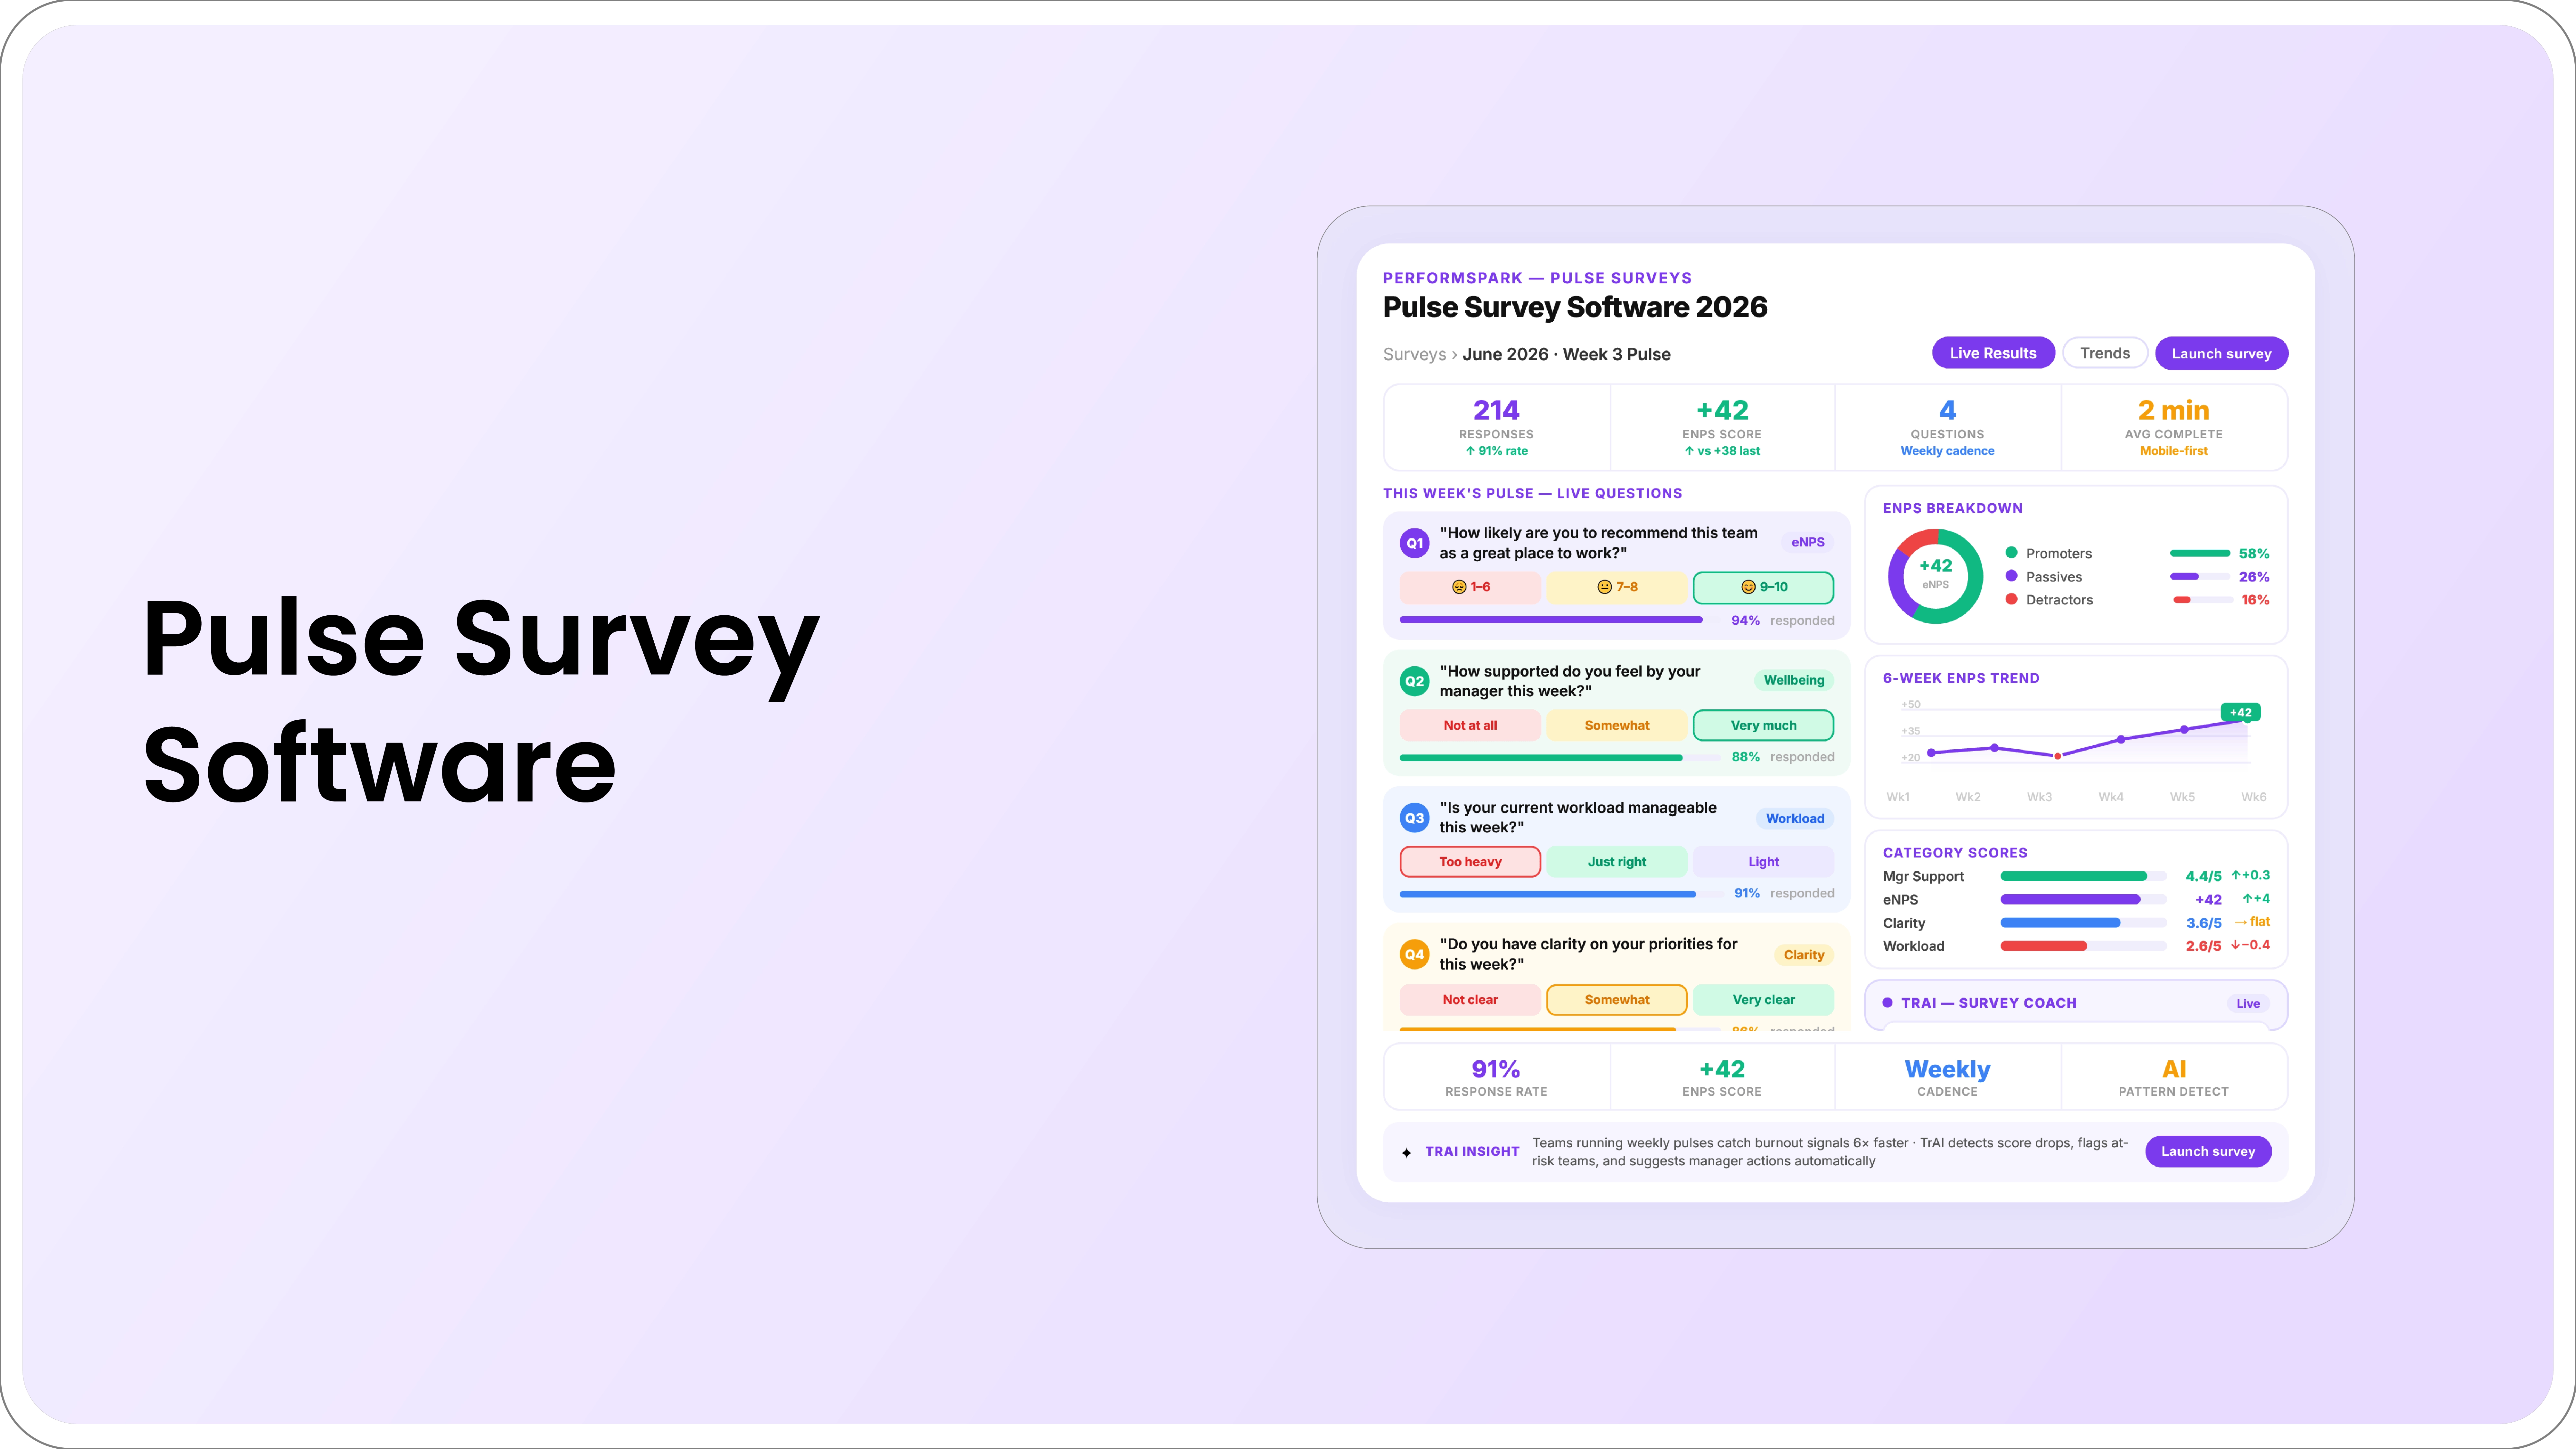
2. Pulse Surveys
Employee pulse surveys are short, usually 3 to 10 questions, distributed weekly, monthly, or quarterly. They trade comprehensiveness for frequency, giving HR and managers a near real-time read on sentiment shifts rather than waiting for the annual cycle, and they work best when the same core questions repeat over time so trend lines stay comparable.
3. Employee Net Promoter Score (eNPS)
A single-question metric asking employees how likely they are to recommend the organization as a place to work, scored zero to ten. Respondents are grouped into promoters (9 to 10), passives (7 to 8), and detractors (0 to 6), and eNPS is calculated as the percentage of promoters minus the percentage of detractors. eNPS is fast to deploy and easy to trend, but it is a single proxy metric, not a full engagement measurement, since it captures loyalty sentiment without explaining the underlying drivers.
4. Behavioral and Performance Signals
The layer most engagement programs skip entirely. Performance management systems already capture behavioral data that correlates strongly with engagement: completion rates from check-ins and 1:1s, goal progress velocity, peer recognition volume, and feedback request frequency. Unlike survey data, behavioral data updates continuously and cannot be skewed by survey fatigue or social desirability bias, since it reflects what employees actually do rather than what they report feeling.
Practitioner Insight: A manager will often say engagement on their team feels fine because the last survey score was acceptable, while goal completion on that same team has quietly dropped two quarters running. The survey and the behavioral data are telling two different stories, and the behavioral data is usually the earlier warning. Teams that pair both data sources catch disengagement risk roughly a full quarter before it would otherwise surface.
5. Stay Interviews and Qualitative Feedback
One-on-one conversations, distinct from exit interviews, where a manager or HRBP asks current employees what is working and what would make them consider leaving. Stay interviews surface specific, actionable detail that a Likert-scale survey question cannot, particularly around manager relationship quality and unspoken frustrations.
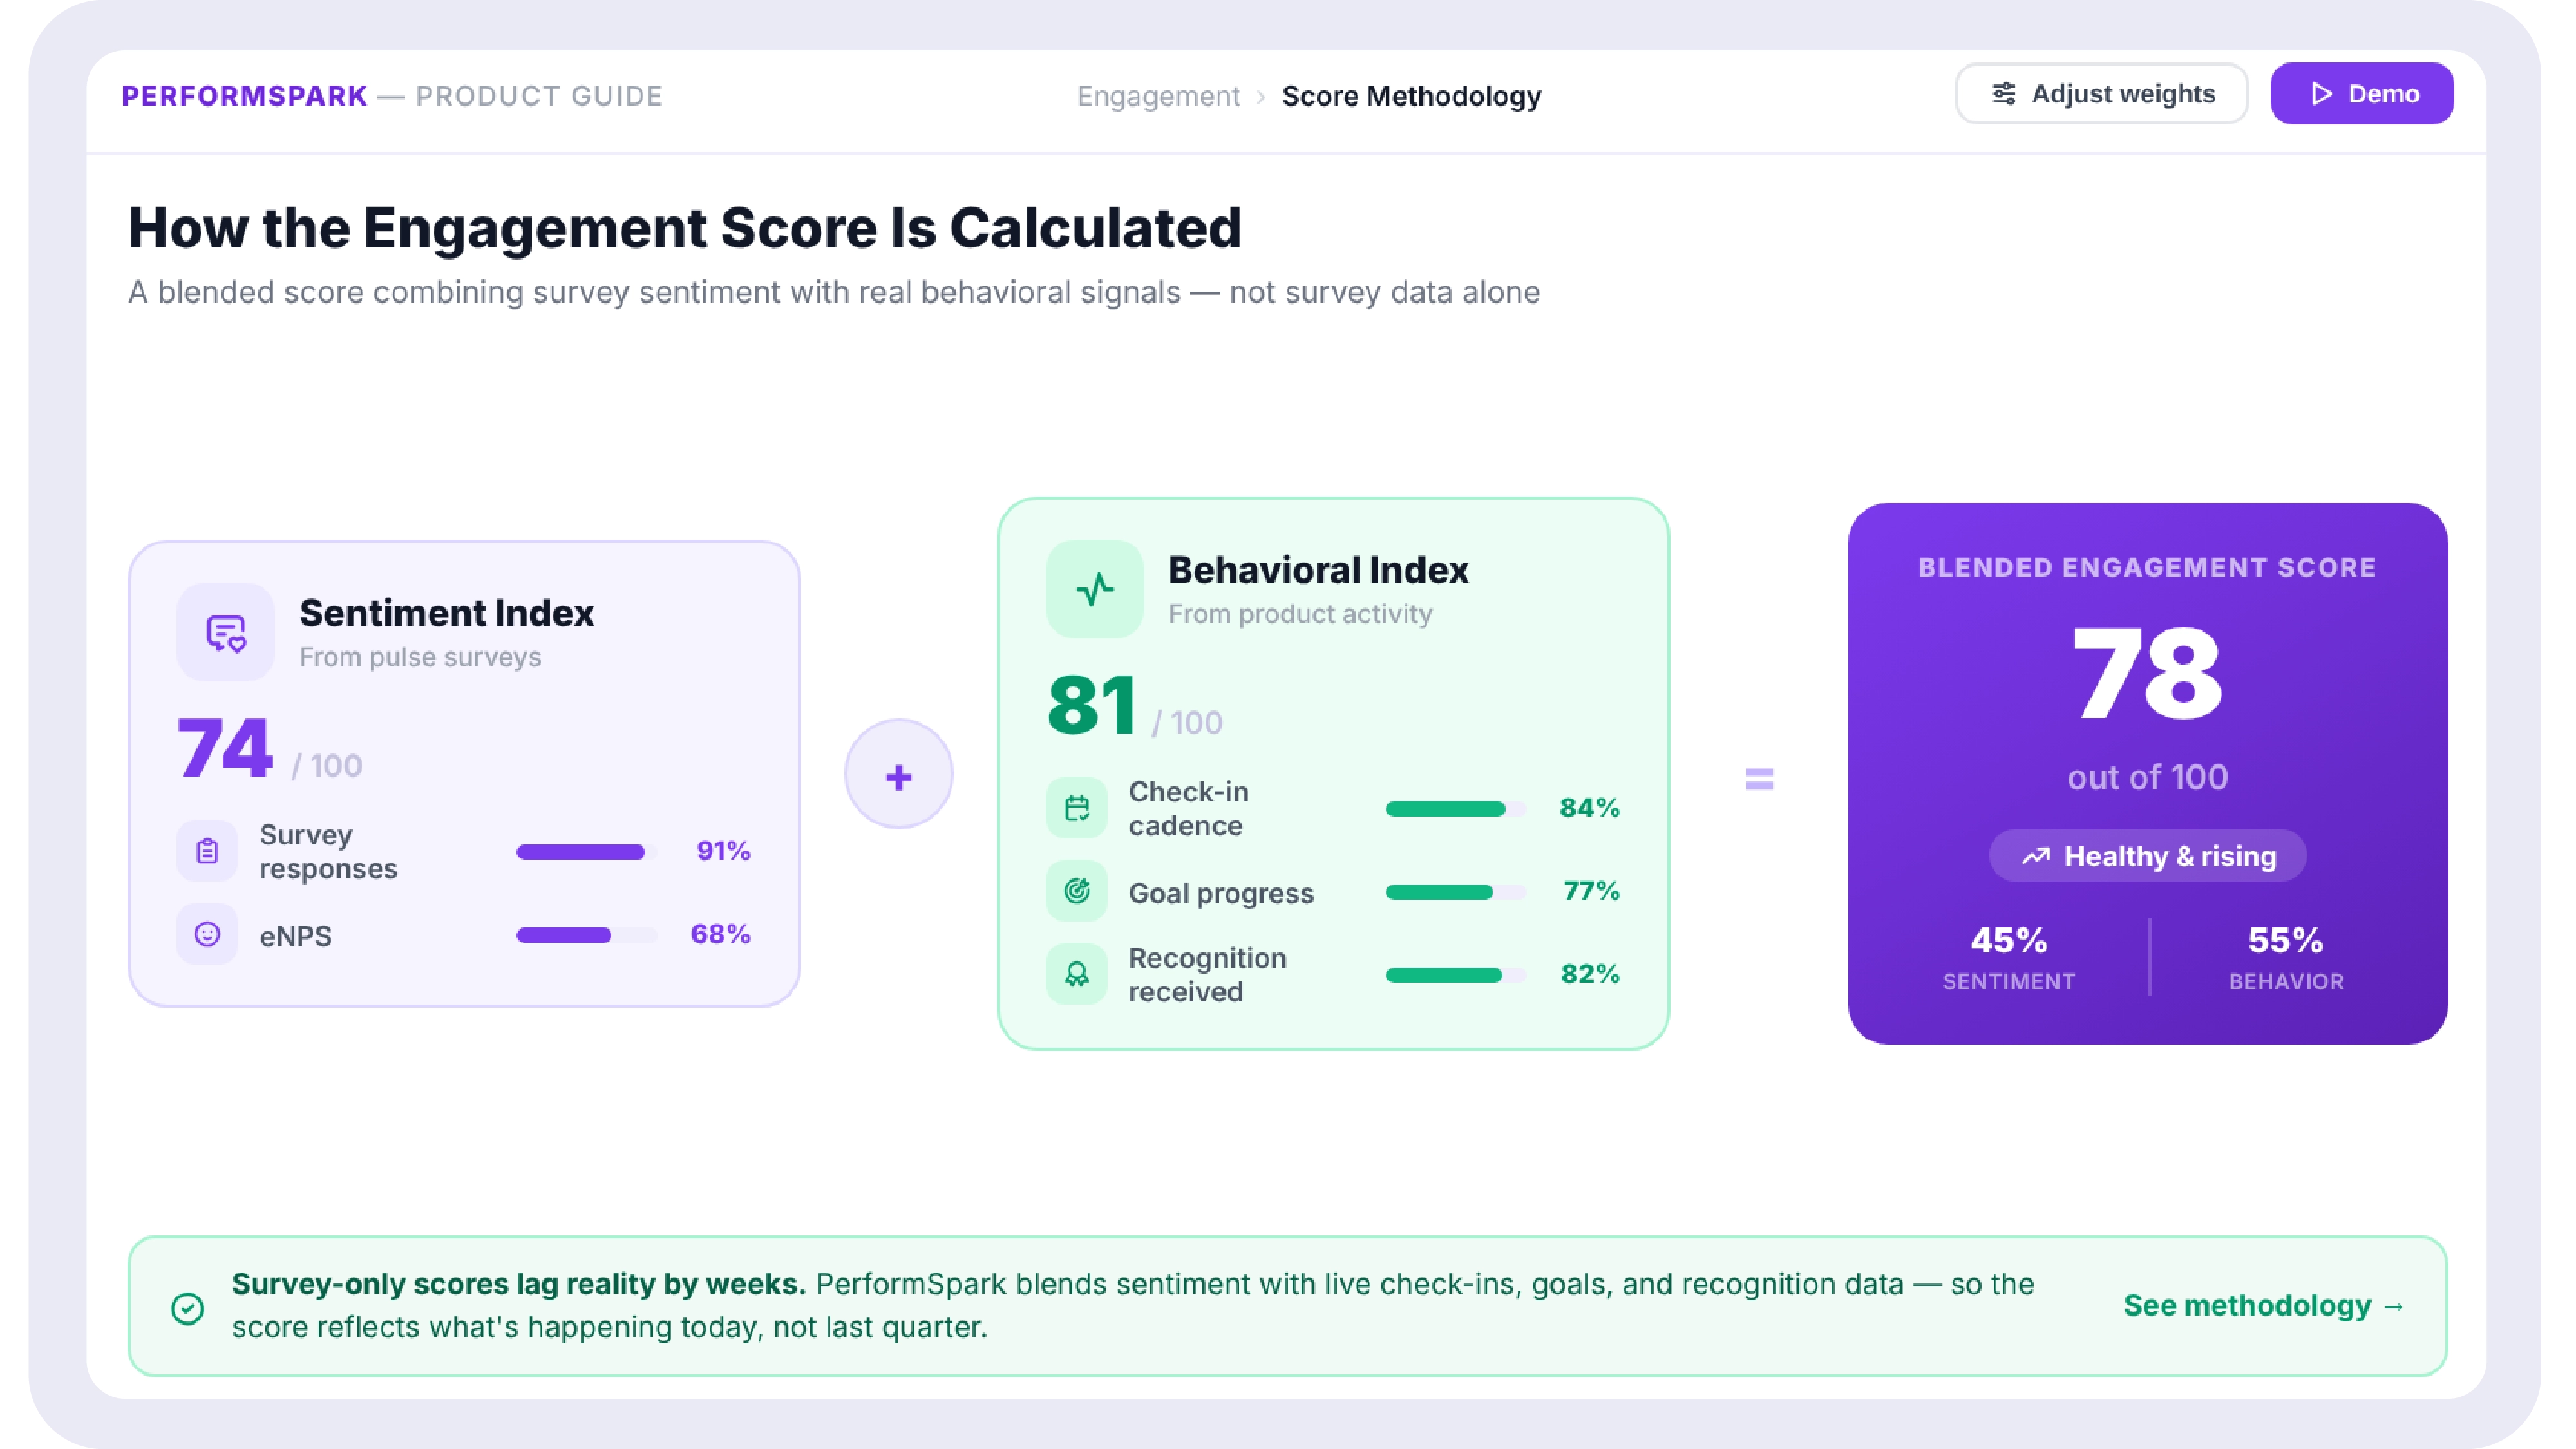
How to Calculate an Employee Engagement Score
There is no single universal formula, but a defensible engagement score combines a survey-derived sentiment index with a behavioral index, weighted according to what the organization can reliably capture.
- Step 1: Build the sentiment index. Average the response scores across 5 to 8 core engagement survey items (not satisfaction items) on a consistent scale, typically 1 to 5. Convert to a 0 to 100 index for easier trending.
- Step 2: Build the behavioral index. Combine 3 to 5 behavioral signals into a weighted index: check-in completion rate, goal progress against target pulled directly from your goal tracking software, 1:1 attendance rate, and recognition received. Normalize each to a 0 to 100 scale before combining.
- Step 3: Weight and combine. A common starting weighting is 60 percent sentiment index, 40 percent behavioral index, adjusted over time as the organization learns which behavioral signals correlate most strongly with actual turnover in its own data.
- Step 4: Segment by team and tenure. A company-wide engagement score hides the teams that need intervention. Calculate the score at the team level and the tenure-cohort level (under 1 year, 1 to 3 years, 3-plus years), since disengagement drivers differ significantly by cohort.
- Step 5: Set a re-measurement cadence. Recalculate the behavioral index continuously, since the underlying data updates in real time. Recalculate the sentiment index at each pulse or annual survey cycle, and track the combined score on a rolling quarterly basis.
Employee Engagement Metrics and KPIs to Track
Beyond the composite score, the following individual metrics give HR and managers a more granular diagnostic view of where engagement is strong or slipping.
- Survey participation rate. Below 60 percent participation undermines the statistical reliability of the result and is itself a disengagement signal.
- eNPS trend. Tracked quarter over quarter rather than as a single snapshot, since direction of movement matters more than the absolute number.
- Voluntary turnover rate by team. The lagging confirmation metric. Teams with declining engagement scores should show this as a leading indicator before turnover spikes.
- Check-in completion rate. The percentage of scheduled 1:1s and check-ins that actually occur, broken out by manager.
- Goal completion velocity. Whether goals are progressing on the expected timeline, not just whether they eventually get marked complete.
- Recognition frequency. Peer-to-peer and manager-to-employee recognition volume, since recognition frequency correlates with both engagement and retention.
- Internal mobility and L&D participation. Sign-ups for internal roles, mentorship, and learning programs signal employees who see a future at the organization rather than just a paycheck.
Centralizing these numbers inside employee engagement analytics keeps team-level trends visible without manual spreadsheet work, and it is what turns this list from a reporting exercise into an early-warning system.
Building an Employee Engagement Survey That Gets Honest Answers
The quality of engagement measurement depends entirely on whether employees trust the process enough to answer honestly. A technically well-designed survey with low trust produces unreliable data regardless of question quality.
- Use validated question frameworks. Base core questions on established, research-backed scales rather than custom-written items. Small wording changes between survey cycles break year-over-year comparability.
- Keep annual surveys under 60 questions. Completion rates drop sharply past this length, and longer surveys do not meaningfully improve data quality once core drivers are covered.
- Distinguish anonymous from confidential. Most engagement platforms offer confidentiality, where HR can see individual responses but commits not to expose them to managers, rather than true anonymity. State this distinction explicitly so employees calibrate their honesty correctly.
- Include open-ended questions sparingly. One or two open-text fields surface details that scaled questions miss, but too many reduce completion rates and create unmanageable qualitative analysis backlogs.
- Communicate the "why" before launch. Participation and honesty both increase when employees understand what the data will be used for and have seen evidence that past survey results led to visible action.
Common Mistakes When Measuring Employee Engagement
- Measuring without closing the loop. Running a survey and never communicating results or visible follow-up action is the single fastest way to collapse future participation rates and employee trust in the process.
- Treating eNPS as the whole picture. A single loyalty question cannot explain why scores moved, only that they did. Pair it with driver-level questions and behavioral data.
- Surveying too often without acting fast enough. Monthly pulse surveys with a quarterly action cadence create a visible gap between asking and responding that employees notice and resent.
- Ignoring team-level variance. A healthy company average can hide one or two teams in active crisis. Segment every report by team and by manager.
- Changing survey questions every cycle. Breaks the trend line and makes it impossible to tell whether a score moved because of a real shift or a different question.
From Measurement to Action: Building an Engagement Strategy
Measurement is the diagnostic step, not the intervention. A complete engagement strategy converts the data into specific, owned actions.
- Share results transparently. Publish topline results and team-level themes (not individual responses) back to the organization within weeks of survey close, not months.
- Assign owners to priority drivers. If recognition scores are low company-wide, that becomes a specific owned initiative, not a general talking point in an all-hands deck.
- Train managers on the behavioral levers they control. Most engagement drivers- recognition, check-in consistency, role clarity- sit with the direct manager. Equip managers with their own team-level data, not just the company rollup.
- Re-measure on a defined cadence. Track whether actions taken actually moved the score, using the same blended sentiment and behavioral approach described above.
Choosing Employee Engagement Software
Most organizations evaluating employee engagement software are really choosing between three categories: standalone survey tools, dedicated engagement platforms, and performance management platforms with engagement measurement built in. The right choice depends on whether engagement data needs to connect to the performance data HR already manages.
- Survey-only tools. Fast to deploy and inexpensive, but engagement scores sit isolated from check-in, goal, and recognition data, requiring manual cross-referencing to spot the behavioral signals that explain a sentiment shift.
- Standalone engagement platforms. Stronger survey design and benchmarking features, but typically still require a separate integration to pull in performance data, adding setup time and a second system for managers to check.
- Performance management platforms with built-in engagement measurement. Surveys, eNPS, check-in data, goal data, and recognition data live in the same system, so a manager sees the full picture, sentiment, and behavior in one dashboard rather than reconciling two tools.
When evaluating any option, confirm it supports validated survey frameworks, segmented reporting by team and tenure, a clear confidentiality model, and either native or integrated access to behavioral performance data. Calculate the likely ROI before committing budget using the employee engagement ROI calculator , since engagement software is frequently positioned on soft benefit without a clear cost-avoidance case.
Employee engagement is measurable with the same discipline applied to any other business metric, but only when the measurement program goes beyond an annual survey. Sentiment data tells you how people feel. Behavioral data- check-in consistency, goal velocity, recognition frequency- tells you whether that feeling is showing up in daily work, and it does so weeks before the next survey cycle would catch it.
The organizations that get the most value from engagement measurement are the ones that treat it as a continuous, blended signal rather than a once-a-year report, and that close the loop by turning every result into a visible, owned action. The strongest programs treat their HR engagement tools and performance management system as one connected stack, not two separate platforms to reconcile every quarter, giving managers team-level visibility instead of a single company-wide number.
Key Takeaways
- Employee engagement measures emotional commitment and discretionary effort, not just satisfaction or happiness at work.
- A reliable engagement score blends survey data (annual surveys, pulse surveys, eNPS) with behavioral data already captured in performance management software.
- eNPS alone is a useful pulse check but is not a substitute for a full engagement score; treat it as one input among several.
- Engagement measurement only creates value when paired with a visible action loop. Survey-only programs without follow-through reduce future participation rates.
- Connecting engagement signals to check-ins, goals, and recognition data lets HR and managers spot disengagement risk weeks before it appears in an annual survey or a resignation letter.
Most HR teams can describe what disengagement looks like long before they can prove it. A team that used to volunteer for stretch projects has gone quiet. Goal completion has slipped from 90 percent to 60 percent over two quarters. Manager 1:1s get rescheduled, then skipped. None of this shows up on a dashboard until someone runs the annual engagement survey, and by then, the best people have often already updated their resumes.
Employee engagement is not a soft metric. It is a leading indicator of turnover, productivity, and customer outcomes, and it is measurable with the same rigor HR teams apply to compensation or headcount planning. The problem is not a lack of survey tools. Most organizations already run an annual engagement survey, and many have added pulse surveys on top of it. The problem is that survey data alone tells you how people feel without telling you whether that feeling is showing up in their actual work.
This guide defines employee engagement precisely, separates it from the adjacent concepts it gets confused with, and walks through the specific methods, formulas, and metrics used to measure it. It also covers where most measurement programs break down and how connecting engagement data to performance management data closes the gap between knowing engagement dropped and knowing why.
What Is Employee Engagement?
Employee engagement is the degree to which an employee feels emotionally invested in their work and is willing to put in discretionary effort beyond their minimum job requirements. It captures three connected dimensions: cognitive engagement (belief in the organization's direction), emotional engagement (a sense of connection to the team and the work itself), and behavioral engagement (the extra effort an employee chooses to apply when no one is checking).
The concept originated in organizational psychology research in the 1990s and has since become a standard HR metric because it correlates strongly with retention, productivity, and customer satisfaction. An engaged employee does not just complete their tasks. They proactively flag problems, mentor newer colleagues, and stay through difficult stretches that would push a disengaged employee to start interviewing elsewhere.
Practitioner Insight: HR leaders often run an annual engagement survey and report the topline score to leadership, but cannot answer the next question: which teams are actually at risk right now. The fix is not a better survey question. It is pairing survey sentiment with the behavioral data already sitting in the performance system, so a dropping engagement score on a team also shows up as fewer completed check-ins and stalled goals for that same team, weeks before the next survey cycle.
Why Measuring Employee Engagement Matters Now
Organizations with consistently high engagement scores see measurably lower voluntary turnover, higher goal completion rates, and stronger internal promotion pipelines compared to organizations that treat engagement as a once-a-year survey exercise. The business case has three parts.
- Retention cost avoidance. Replacing a mid-level employee typically costs six to nine months of their salary in recruiting, onboarding, and lost productivity. Catching disengagement early through behavioral signals gives managers time to intervene before resignation, not after.
- Productivity and goal velocity. Engaged employees complete a higher percentage of their assigned goals on schedule. When goal completion rates drop across a team without a corresponding change in workload, that is frequently an engagement signal arriving before the survey data does.
- Manager accountability. Engagement is not evenly distributed. It is heavily influenced by manager effectiveness , since direct managers control most of the day-to-day drivers: recognition, role clarity, and check-in consistency. Measuring engagement at the team level, not just the company level, is what makes the data actionable for manager coaching rather than just an HR talking point.
Employee Engagement vs Employee Satisfaction vs Employee Experience
These three terms get used interchangeably in casual HR conversations, but they measure different things and require different survey instruments. Conflating them is one of the most common reasons engagement programs produce confusing or contradictory results.
A useful distinction practitioners use: satisfaction is about whether the job is good enough to stay in, while engagement is about whether the employee wants to go above and beyond while they are there. An employee can be satisfied with their pay and schedule while being fully disengaged from the actual work, which is exactly why satisfaction scores alone are a poor proxy for engagement. Systems that already track recognition, such as employee recognition software, often surface that gap before a survey does.
Core Methods for Measuring Employee Engagement
No single method captures engagement completely. The methods below work as layers, with surveys capturing stated sentiment and behavioral data capturing whether that sentiment translates into action.
1. Annual Engagement Surveys
A comprehensive is survey distributed once or twice a year, typically with 40 to 60 questions covering core drivers: purpose, manager support, growth opportunity, recognition, and workplace conditions. Annual surveys provide a statistically reliable baseline and a year-over-year benchmark, but the 12-month gap between data points means problems can develop and resolve, or develop and cause a resignation, entirely between survey cycles.
2. Pulse Surveys
Employee pulse surveys are short, usually 3 to 10 questions, distributed weekly, monthly, or quarterly. They trade comprehensiveness for frequency, giving HR and managers a near real-time read on sentiment shifts rather than waiting for the annual cycle, and they work best when the same core questions repeat over time so trend lines stay comparable.
3. Employee Net Promoter Score (eNPS)
A single-question metric asking employees how likely they are to recommend the organization as a place to work, scored zero to ten. Respondents are grouped into promoters (9 to 10), passives (7 to 8), and detractors (0 to 6), and eNPS is calculated as the percentage of promoters minus the percentage of detractors. eNPS is fast to deploy and easy to trend, but it is a single proxy metric, not a full engagement measurement, since it captures loyalty sentiment without explaining the underlying drivers.
4. Behavioral and Performance Signals
The layer most engagement programs skip entirely. Performance management systems already capture behavioral data that correlates strongly with engagement: completion rates from check-ins and 1:1s, goal progress velocity, peer recognition volume, and feedback request frequency. Unlike survey data, behavioral data updates continuously and cannot be skewed by survey fatigue or social desirability bias, since it reflects what employees actually do rather than what they report feeling.
Practitioner Insight: A manager will often say engagement on their team feels fine because the last survey score was acceptable, while goal completion on that same team has quietly dropped two quarters running. The survey and the behavioral data are telling two different stories, and the behavioral data is usually the earlier warning. Teams that pair both data sources catch disengagement risk roughly a full quarter before it would otherwise surface.
5. Stay Interviews and Qualitative Feedback
One-on-one conversations, distinct from exit interviews, where a manager or HRBP asks current employees what is working and what would make them consider leaving. Stay interviews surface specific, actionable detail that a Likert-scale survey question cannot, particularly around manager relationship quality and unspoken frustrations.
How to Calculate an Employee Engagement Score
There is no single universal formula, but a defensible engagement score combines a survey-derived sentiment index with a behavioral index, weighted according to what the organization can reliably capture.
- Step 1: Build the sentiment index. Average the response scores across 5 to 8 core engagement survey items (not satisfaction items) on a consistent scale, typically 1 to 5. Convert to a 0 to 100 index for easier trending.
- Step 2: Build the behavioral index. Combine 3 to 5 behavioral signals into a weighted index: check-in completion rate, goal progress against target pulled directly from your goal tracking software, 1:1 attendance rate, and recognition received. Normalize each to a 0 to 100 scale before combining.
- Step 3: Weight and combine. A common starting weighting is 60 percent sentiment index, 40 percent behavioral index, adjusted over time as the organization learns which behavioral signals correlate most strongly with actual turnover in its own data.
- Step 4: Segment by team and tenure. A company-wide engagement score hides the teams that need intervention. Calculate the score at the team level and the tenure-cohort level (under 1 year, 1 to 3 years, 3-plus years), since disengagement drivers differ significantly by cohort.
- Step 5: Set a re-measurement cadence. Recalculate the behavioral index continuously, since the underlying data updates in real time. Recalculate the sentiment index at each pulse or annual survey cycle, and track the combined score on a rolling quarterly basis.
Employee Engagement Metrics and KPIs to Track
Beyond the composite score, the following individual metrics give HR and managers a more granular diagnostic view of where engagement is strong or slipping.
- Survey participation rate. Below 60 percent participation undermines the statistical reliability of the result and is itself a disengagement signal.
- eNPS trend. Tracked quarter over quarter rather than as a single snapshot, since direction of movement matters more than the absolute number.
- Voluntary turnover rate by team. The lagging confirmation metric. Teams with declining engagement scores should show this as a leading indicator before turnover spikes.
- Check-in completion rate. The percentage of scheduled 1:1s and check-ins that actually occur, broken out by manager.
- Goal completion velocity. Whether goals are progressing on the expected timeline, not just whether they eventually get marked complete.
- Recognition frequency. Peer-to-peer and manager-to-employee recognition volume, since recognition frequency correlates with both engagement and retention.
- Internal mobility and L&D participation. Sign-ups for internal roles, mentorship, and learning programs signal employees who see a future at the organization rather than just a paycheck.
Centralizing these numbers inside employee engagement analytics keeps team-level trends visible without manual spreadsheet work, and it is what turns this list from a reporting exercise into an early-warning system.
Building an Employee Engagement Survey That Gets Honest Answers
The quality of engagement measurement depends entirely on whether employees trust the process enough to answer honestly. A technically well-designed survey with low trust produces unreliable data regardless of question quality.
- Use validated question frameworks. Base core questions on established, research-backed scales rather than custom-written items. Small wording changes between survey cycles break year-over-year comparability.
- Keep annual surveys under 60 questions. Completion rates drop sharply past this length, and longer surveys do not meaningfully improve data quality once core drivers are covered.
- Distinguish anonymous from confidential. Most engagement platforms offer confidentiality, where HR can see individual responses but commits not to expose them to managers, rather than true anonymity. State this distinction explicitly so employees calibrate their honesty correctly.
- Include open-ended questions sparingly. One or two open-text fields surface details that scaled questions miss, but too many reduce completion rates and create unmanageable qualitative analysis backlogs.
- Communicate the "why" before launch. Participation and honesty both increase when employees understand what the data will be used for and have seen evidence that past survey results led to visible action.
Common Mistakes When Measuring Employee Engagement
- Measuring without closing the loop. Running a survey and never communicating results or visible follow-up action is the single fastest way to collapse future participation rates and employee trust in the process.
- Treating eNPS as the whole picture. A single loyalty question cannot explain why scores moved, only that they did. Pair it with driver-level questions and behavioral data.
- Surveying too often without acting fast enough. Monthly pulse surveys with a quarterly action cadence create a visible gap between asking and responding that employees notice and resent.
- Ignoring team-level variance. A healthy company average can hide one or two teams in active crisis. Segment every report by team and by manager.
- Changing survey questions every cycle. Breaks the trend line and makes it impossible to tell whether a score moved because of a real shift or a different question.
From Measurement to Action: Building an Engagement Strategy
Measurement is the diagnostic step, not the intervention. A complete engagement strategy converts the data into specific, owned actions.
- Share results transparently. Publish topline results and team-level themes (not individual responses) back to the organization within weeks of survey close, not months.
- Assign owners to priority drivers. If recognition scores are low company-wide, that becomes a specific owned initiative, not a general talking point in an all-hands deck.
- Train managers on the behavioral levers they control. Most engagement drivers- recognition, check-in consistency, role clarity- sit with the direct manager. Equip managers with their own team-level data, not just the company rollup.
- Re-measure on a defined cadence. Track whether actions taken actually moved the score, using the same blended sentiment and behavioral approach described above.
Choosing Employee Engagement Software
Most organizations evaluating employee engagement software are really choosing between three categories: standalone survey tools, dedicated engagement platforms, and performance management platforms with engagement measurement built in. The right choice depends on whether engagement data needs to connect to the performance data HR already manages.
- Survey-only tools. Fast to deploy and inexpensive, but engagement scores sit isolated from check-in, goal, and recognition data, requiring manual cross-referencing to spot the behavioral signals that explain a sentiment shift.
- Standalone engagement platforms. Stronger survey design and benchmarking features, but typically still require a separate integration to pull in performance data, adding setup time and a second system for managers to check.
- Performance management platforms with built-in engagement measurement. Surveys, eNPS, check-in data, goal data, and recognition data live in the same system, so a manager sees the full picture, sentiment, and behavior in one dashboard rather than reconciling two tools.
When evaluating any option, confirm it supports validated survey frameworks, segmented reporting by team and tenure, a clear confidentiality model, and either native or integrated access to behavioral performance data. Calculate the likely ROI before committing budget using the employee engagement ROI calculator , since engagement software is frequently positioned on soft benefit without a clear cost-avoidance case.
Employee engagement is measurable with the same discipline applied to any other business metric, but only when the measurement program goes beyond an annual survey. Sentiment data tells you how people feel. Behavioral data- check-in consistency, goal velocity, recognition frequency- tells you whether that feeling is showing up in daily work, and it does so weeks before the next survey cycle would catch it.
The organizations that get the most value from engagement measurement are the ones that treat it as a continuous, blended signal rather than a once-a-year report, and that close the loop by turning every result into a visible, owned action. The strongest programs treat their HR engagement tools and performance management system as one connected stack, not two separate platforms to reconcile every quarter, giving managers team-level visibility instead of a single company-wide number.
.webp)


.svg)

.svg)
.svg)

