



HR & People

How to Calculate Employee Turnover Rate (With Formula and Industry Benchmarks)

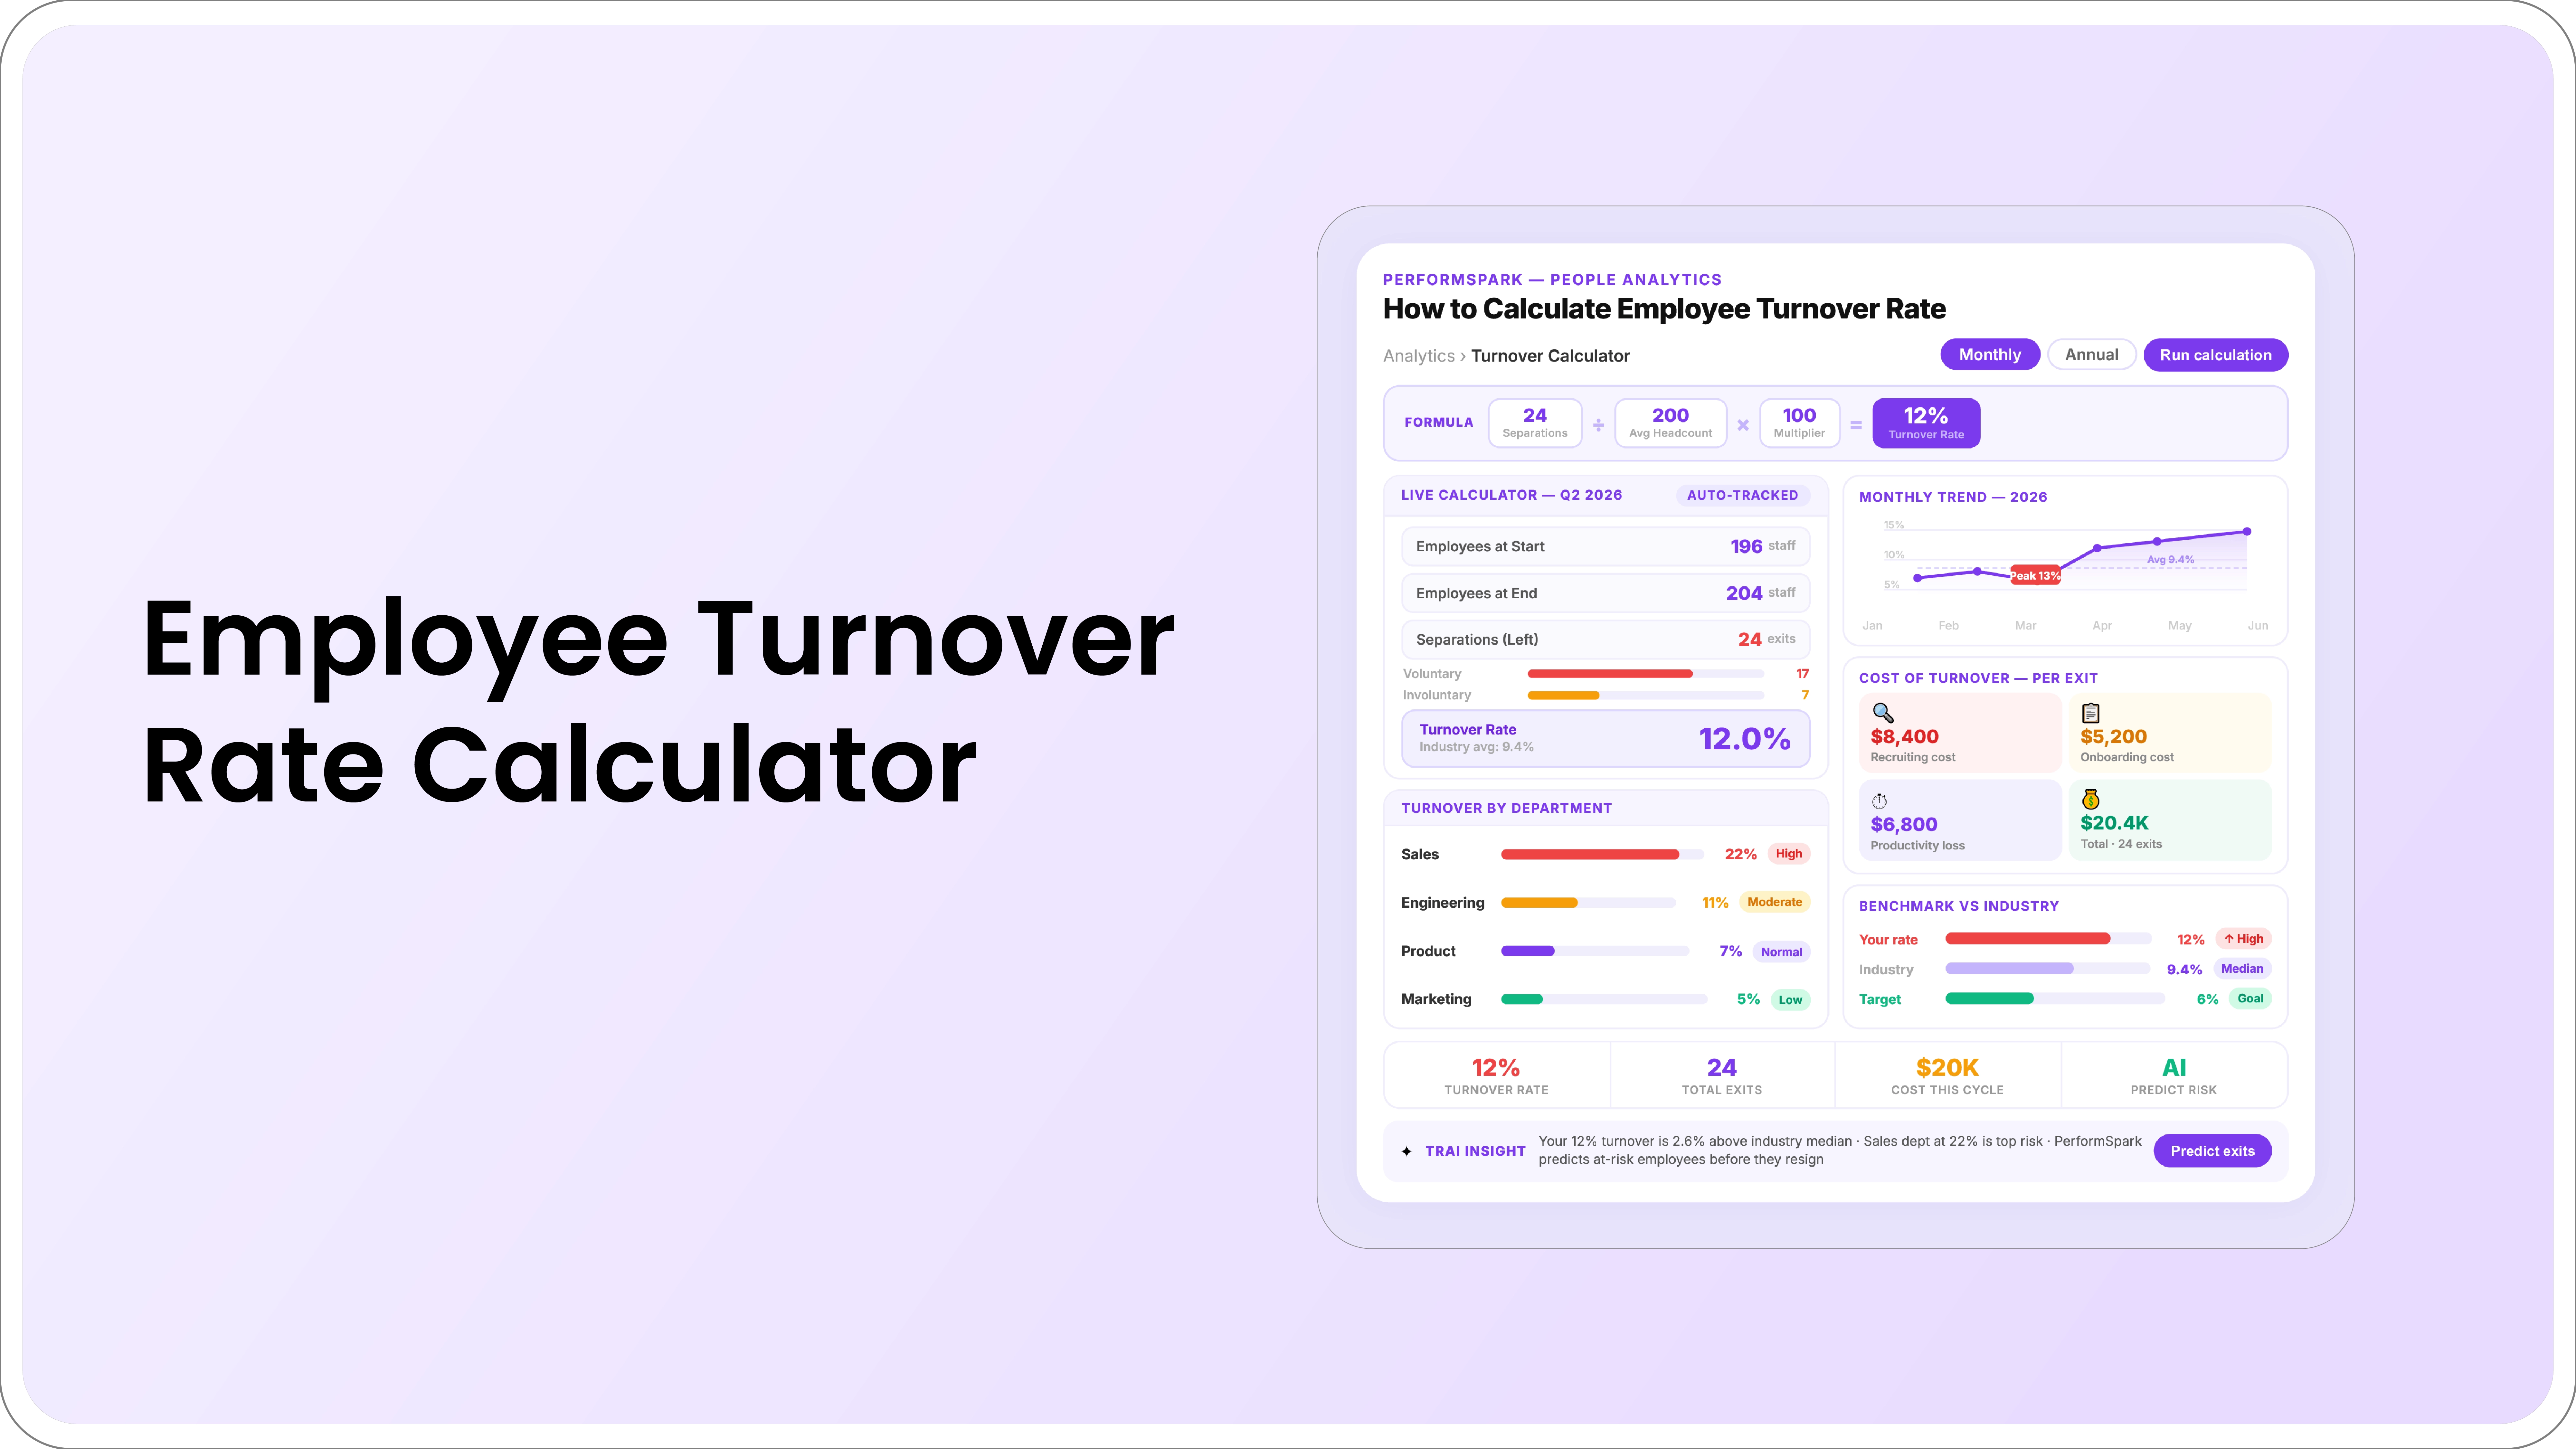
Employee turnover rate is the percentage of employees who leave an organization during a defined period, calculated by dividing the number of separations by the average headcount and multiplying by 100. The formula is: Turnover Rate = (Separations Γ· Average Headcount) Γ— 100. Voluntary and involuntary turnover should always be calculated separately because they signal different organizational problems and require different responses.

Updated :
April 28, 2026

Mahesh Kumar

Founder, TraineryHCM.com
How to Calculate Employee Turnover Rate

Table of Content

Employee turnover rate is one of the few HR metrics that connects directly to revenue, productivity, and organizational stability. Get the number right, and you have a defensible baseline for headcount planning and manager effectiveness conversations. Get the calculation wrong, or track only the headline number, and you miss the signals that actually predict retention risk.

This guide gives you the exact formula, two worked examples including a department-level breakdown, the distinction between voluntary and involuntary turnover, 2026 industry benchmarks, a bonus retention rate formula, and the most actionable use of turnover data that most HR leaders overlook: segmenting by manager.

Practitioner Insight:Β  A common issue teams run into: they calculate a company-wide turnover rate of 18%, declare it within normal range, and move on. Two months later, an entire product team turns over because one manager had a 47% rate that was invisible in the aggregate. The company-wide number is useful for board reporting. The department-level number is useful for actually fixing things.

The Employee Turnover Rate Formula

The standard formula used across HR reporting, BLS labor statistics, and the SHRM benchmarking methodology is:

Employee Turnover Formula

Employee Turnover Rate = ( Number of Separations Γ· Average Headcount ) Γ— 100
Average Headcount = ( Headcount at Start of Period + Headcount at End of Period ) Γ· 2

Worked Example: Monthly Calculation

A company begins January with 200 employees and ends January with 190 employees. During the month, 15 employees left.

  • Average headcount: (200 + 190) Γ· 2 = 195
  • Monthly turnover rate: (15 Γ· 195) Γ— 100 = 7.7%

A 7.7% monthly rate annualizes to approximately 92%, meaning the company would theoretically replace its entire workforce in just over a year. This is why monthly rates always need to be stated as monthly rates, not annualized without that context.

Worked Example: Annual Calculation

A company starts the year with 340 employees, ends the year with 360 employees, and had 52 separations during the year.

  • Average headcount: (340 + 360) Γ· 2 = 350
  • Annual turnover rate: (52 Γ· 350) Γ— 100 = 14.9%

This falls within the professional services benchmark range of 12–18%, which looks acceptable until you segment it by department, as the next example shows.

Why Company-Wide Rates Are Often Misleading: A Department Example

In the 14.9% example above, the company-wide rate masks what is actually happening inside the organization. Here is the same 52 separations broken down by department:

Department Headcount Separations Turnover Rate Signal
Engineering 80 6 7.5% Healthy
Sales 60 9 15.0% Monitor
Customer Success 50 4 8.0% Healthy
Operations 40 8 20.0% At Risk
Support 60 22 36.7% Critical
HR & Finance 60 3 5.0% Healthy
TOTAL 350 52 14.9% Misleading

The Support team at 36.7% is running a retention crisis. The company-wide 14.9% rate gives leadership no reason to act. This is why department-level segmentation is not optional; it is where the actual signal lives.

Voluntary vs Involuntary Turnover: Why You Must Track Them Separately

Most basic turnover calculations combine all separations into one number. This is almost always a mistake, because voluntary and involuntary turnover signal completely different organizational problems.

Voluntary Turnover

Voluntary turnover is when the employee initiates the separation: resignations, retirements, and departures for personal reasons. Voluntary turnover is the metric most HR leaders and executives care about because it reflects employee satisfaction, manager quality, and organizational health. It is also the turnover type that is most preventable.

Voluntary turnover formula: (Number of voluntary separations Γ· Average headcount) Γ— 100

Involuntary Turnover

Involuntary turnover is when the organization initiates the separation: terminations for performance, redundancies, role eliminations, and restructuring. Involuntary turnover is not inherently a negative signal; some level of performance-managed exits is expected in a healthy organization. It becomes a concern when it is unusually high, suggesting either poor hiring quality or ineffective performance management before the termination point.

Involuntary turnover formula: (Number of involuntary separations Γ· Average headcount) Γ— 100

Regrettable vs Non-Regrettable Turnover

The most operationally useful distinction goes one level further: separating regrettable turnover from non-regrettable turnover within the voluntary category.

Regrettable turnover is when a high-performing or high-potential employee leaves voluntarily, someone the organization genuinely wanted to retain. Non-regrettable turnover is when a low-performing or poor-fit employee leaves, which may actually be a healthy outcome.

Most organizations track total voluntary turnover but do not distinguish between these two. A voluntary turnover rate of 15% means something very different if most of those departures were regrettable exits versus performance-related churn.

Practitioner Insight: In real-world implementations, regrettable turnover is one of the hardest metrics to track because it requires a manager's judgment call at the point of exit. The most reliable way to capture it is a structured exit classification question in the offboarding process, not a retrospective HR assessment done weeks after the departure.

How to Annualize a Monthly or Quarterly Turnover Rate

A common mistake in turnover reporting is multiplying the monthly rate by 12 to get an annual figure. This is mathematically incorrect and produces an inflated estimate.

The correct annualization formula is:

Annualized Turnover RateΒ  =Β  [ 1 βˆ’ ( 1 βˆ’ Monthly Rate )^12 ]Β  Γ—Β  100

Example: A monthly turnover rate of 1.5% annualizes as follows:

= [ 1 βˆ’ ( 1 βˆ’ 0.015 )^12 ] Γ— 100 = [ 1 βˆ’ ( 0.985 )^12 ] Γ— 100 = [ 1 βˆ’ 0.832 ] Γ— 100 = 16.8%

Multiplying 1.5% by 12 would give 18%, which overstates the actual annual rate by more than a percentage point. For large organizations, this difference is meaningful in board reporting and headcount projections.

2026 Employee Turnover Rate Benchmarks by Industry

The following benchmarks are based on US Bureau of Labor Statistics Job Openings and Labor Turnover Survey (JOLTS) data, Mercer 2025 Workforce Trends Survey of 2,617 organizations, and SHRM Compensation and Benefits Survey methodology. Use these to contextualize your organization's rate before drawing conclusions from the number alone.

Industry Annual Turnover Rate Signal Threshold
Hospitality and Food Service 70–80% Structural, high-volume hiring expected
Retail 40–60% Structural, seasonal and part-time dynamics
Healthcare (Clinical) 20–30% Elevated, burnout, and credential competition
Manufacturing 20–30% Industry norm, physical role demands
Technology and SaaS 13–18% Healthy range, competition for senior talent
Financial Services 10–15% Stable, regulated environments retain longer
Professional Services 12–18% Expected, project-based career transitions
Education (K–12 and Higher Ed) 15–20% Rising, compensation pressure increasing
Nonprofit 20–25% Elevated, compensation gap with the private sector

Important context: These are total turnover rates. Voluntary turnover rates are typically 60–70% of the total figure. A SaaS company at 16% total turnover would expect voluntary turnover of approximately 10–12%. Anything significantly above that warrants investigation.

Practitioner Insight Β  Benchmarks are useful for board conversations and investor reporting. They are not useful for identifying why turnover is happening in your organization. A rate within the benchmark range can still be driven by a single team or manager whose impact is hidden in the aggregate. Use benchmarks for external context. Use manager segmentation for internal action.

How to Calculate the Cost of Employee Turnover

The turnover rate tells you how often employees are leaving. Turnover cost tells you what that departure actually costs the organization. For leadership conversations, cost is usually the more compelling number.

The standard cost-of-turnover framework includes four components:

  • Separation costs: Offboarding administration, exit interviews, unemployment insurance contributions, and any severance.
  • Replacement costs: Job posting fees, recruiter time or external agency fees, interview coordination, and background checks.
  • Onboarding and training costs: Onboarding program costs, manager time for ramp-up, training materials, and technology access setup.
  • Productivity loss: The period between an employee departing and their replacement reaching full productivity. For knowledge roles, this typically runs 3 to 6 months.

Cost estimates by role level (commonly cited ranges, based on SHRM and Gallup research):

Role Level Estimated Cost Range Primary Driver
Frontline / Hourly 50–100% of annual salary Replacement recruitment and short ramp
Individual Contributor 75–150% of annual salary Productivity loss during vacancy and ramp
Manager / Senior IC 100–200% of annual salary Knowledge transfer and team disruption
Senior Leader / Executive 200–400% of annual salary Strategic impact and extended search time

Example: A 200-person SaaS company at 15% annual turnover loses 30 employees per year. If the average salary is $80,000 and the average replacement cost is 100% of salary, the annual turnover cost is approximately $2.4 million. A 5-percentage-point reduction in voluntary turnover: 10 fewer departures: saves roughly $800,000.

Employee Retention Rate Formula: The Inverse Metric

Retention rate and turnover rate measure the same dynamic from opposite directions. Some leadership teams find retention rate easier to communicate because it frames the metric positively.

Employee Retention Rate Formula:

Retention RateΒ  =Β  [ ( Employees at End of Period βˆ’ New Hires During Period )Β  Γ·Β  Employees at Start of Period ]Β  Γ—Β  100

Example: A company starts Q3 with 200 employees, hires 20 new employees during Q3, and ends Q3 with 195 employees.

= [ ( 195 βˆ’ 20 ) Γ· 200 ] Γ— 100 = [ 175 Γ· 200 ] Γ— 100 = 87.5% retention rate

Note: New hires are excluded from the retention numerator because retaining an employee who has only been with the organization for two weeks is not the same achievement as retaining a three-year tenured employee.

What Turnover Data Actually Tells You About Manager Effectiveness

The most actionable use of turnover data is not comparing your rate to industry benchmarks. It is segmenting your voluntary turnover rate by manager and cross-referencing it with check-in frequency data.

Research across multiple workforce analytics studies consistently shows that manager quality is the primary driver of voluntary turnover in knowledge worker roles. Employees do not leave organizations; they leave managers. This pattern shows up in turnover data when you have the right segmentation.

The Check-in Frequency Signal

In organizations that track manager coaching cadence, a consistent pattern emerges: managers with low check-in frequency have higher voluntary turnover rates for their direct reports. The relationship is not perfect; other factors contribute, but it is reliable enough to be actionable.

The leading indicator appears 8 to 12 weeks before the resignation. A manager's check-in frequency drops. Pulse survey scores for that team decline. The resignation follows. By the time the resignation arrives, the underlying signal was already visible in the operational data for two to three months.

How to Use This in Practice

Run a quarterly analysis that cross-references the voluntary turnover rate by manager against the check-in completion rate by manager. Any manager with voluntary turnover above your company's average and check-in frequency below your company's average is the most predictable source of future turnover in your organization.

PerformSpark's check-in tracking surfaces manager coaching frequency alongside pulse survey scores so HR can identify the combination before it becomes a resignation, not after it appears in your monthly turnover report.

Common Turnover Rate Calculation Mistakes to Avoid

  • Using headcount at the end of the period as the denominator: This understates the rate when headcount grew during the period. Always use average headcount, (start + end) Γ· 2, as the denominator.
  • Annualizing by multiplying the monthly rate by 12: This overstates the annual rate. Use the compound formula: [1 βˆ’ (1 βˆ’ monthly rate)^12] Γ— 100.
  • Combining voluntary and involuntary turnover: You cannot identify the cause of turnover from a combined number. Track them separately from the first report.
  • Reporting only the company-wide number: Department and manager segmentation is where the actionable signal lives. A healthy company-wide rate can hide a critical team-level problem.

Including internal transfers in separations: An employee who moves from the engineering team to the product team is not a separation. Transfers should be excluded from turnover calculations.

Employee turnover rate is one of the few HR metrics that connects directly to revenue, productivity, and organizational stability. Get the number right, and you have a defensible baseline for headcount planning and manager effectiveness conversations. Get the calculation wrong, or track only the headline number, and you miss the signals that actually predict retention risk.

This guide gives you the exact formula, two worked examples including a department-level breakdown, the distinction between voluntary and involuntary turnover, 2026 industry benchmarks, a bonus retention rate formula, and the most actionable use of turnover data that most HR leaders overlook: segmenting by manager.

Practitioner Insight:Β  A common issue teams run into: they calculate a company-wide turnover rate of 18%, declare it within normal range, and move on. Two months later, an entire product team turns over because one manager had a 47% rate that was invisible in the aggregate. The company-wide number is useful for board reporting. The department-level number is useful for actually fixing things.

The Employee Turnover Rate Formula

The standard formula used across HR reporting, BLS labor statistics, and the SHRM benchmarking methodology is:

Employee Turnover Formula

Employee Turnover Rate = ( Number of Separations Γ· Average Headcount ) Γ— 100
Average Headcount = ( Headcount at Start of Period + Headcount at End of Period ) Γ· 2

Worked Example: Monthly Calculation

A company begins January with 200 employees and ends January with 190 employees. During the month, 15 employees left.

  • Average headcount: (200 + 190) Γ· 2 = 195
  • Monthly turnover rate: (15 Γ· 195) Γ— 100 = 7.7%

A 7.7% monthly rate annualizes to approximately 92%, meaning the company would theoretically replace its entire workforce in just over a year. This is why monthly rates always need to be stated as monthly rates, not annualized without that context.

Worked Example: Annual Calculation

A company starts the year with 340 employees, ends the year with 360 employees, and had 52 separations during the year.

  • Average headcount: (340 + 360) Γ· 2 = 350
  • Annual turnover rate: (52 Γ· 350) Γ— 100 = 14.9%

This falls within the professional services benchmark range of 12–18%, which looks acceptable until you segment it by department, as the next example shows.

Why Company-Wide Rates Are Often Misleading: A Department Example

In the 14.9% example above, the company-wide rate masks what is actually happening inside the organization. Here is the same 52 separations broken down by department:

Department Headcount Separations Turnover Rate Signal
Engineering 80 6 7.5% Healthy
Sales 60 9 15.0% Monitor
Customer Success 50 4 8.0% Healthy
Operations 40 8 20.0% At Risk
Support 60 22 36.7% Critical
HR & Finance 60 3 5.0% Healthy
TOTAL 350 52 14.9% Misleading

The Support team at 36.7% is running a retention crisis. The company-wide 14.9% rate gives leadership no reason to act. This is why department-level segmentation is not optional; it is where the actual signal lives.

Voluntary vs Involuntary Turnover: Why You Must Track Them Separately

Most basic turnover calculations combine all separations into one number. This is almost always a mistake, because voluntary and involuntary turnover signal completely different organizational problems.

Voluntary Turnover

Voluntary turnover is when the employee initiates the separation: resignations, retirements, and departures for personal reasons. Voluntary turnover is the metric most HR leaders and executives care about because it reflects employee satisfaction, manager quality, and organizational health. It is also the turnover type that is most preventable.

Voluntary turnover formula: (Number of voluntary separations Γ· Average headcount) Γ— 100

Involuntary Turnover

Involuntary turnover is when the organization initiates the separation: terminations for performance, redundancies, role eliminations, and restructuring. Involuntary turnover is not inherently a negative signal; some level of performance-managed exits is expected in a healthy organization. It becomes a concern when it is unusually high, suggesting either poor hiring quality or ineffective performance management before the termination point.

Involuntary turnover formula: (Number of involuntary separations Γ· Average headcount) Γ— 100

Regrettable vs Non-Regrettable Turnover

The most operationally useful distinction goes one level further: separating regrettable turnover from non-regrettable turnover within the voluntary category.

Regrettable turnover is when a high-performing or high-potential employee leaves voluntarily, someone the organization genuinely wanted to retain. Non-regrettable turnover is when a low-performing or poor-fit employee leaves, which may actually be a healthy outcome.

Most organizations track total voluntary turnover but do not distinguish between these two. A voluntary turnover rate of 15% means something very different if most of those departures were regrettable exits versus performance-related churn.

Practitioner Insight: In real-world implementations, regrettable turnover is one of the hardest metrics to track because it requires a manager's judgment call at the point of exit. The most reliable way to capture it is a structured exit classification question in the offboarding process, not a retrospective HR assessment done weeks after the departure.

How to Annualize a Monthly or Quarterly Turnover Rate

A common mistake in turnover reporting is multiplying the monthly rate by 12 to get an annual figure. This is mathematically incorrect and produces an inflated estimate.

The correct annualization formula is:

Annualized Turnover RateΒ  =Β  [ 1 βˆ’ ( 1 βˆ’ Monthly Rate )^12 ]Β  Γ—Β  100

Example: A monthly turnover rate of 1.5% annualizes as follows:

= [ 1 βˆ’ ( 1 βˆ’ 0.015 )^12 ] Γ— 100 = [ 1 βˆ’ ( 0.985 )^12 ] Γ— 100 = [ 1 βˆ’ 0.832 ] Γ— 100 = 16.8%

Multiplying 1.5% by 12 would give 18%, which overstates the actual annual rate by more than a percentage point. For large organizations, this difference is meaningful in board reporting and headcount projections.

2026 Employee Turnover Rate Benchmarks by Industry

The following benchmarks are based on US Bureau of Labor Statistics Job Openings and Labor Turnover Survey (JOLTS) data, Mercer 2025 Workforce Trends Survey of 2,617 organizations, and SHRM Compensation and Benefits Survey methodology. Use these to contextualize your organization's rate before drawing conclusions from the number alone.

Industry Annual Turnover Rate Signal Threshold
Hospitality and Food Service 70–80% Structural, high-volume hiring expected
Retail 40–60% Structural, seasonal and part-time dynamics
Healthcare (Clinical) 20–30% Elevated, burnout, and credential competition
Manufacturing 20–30% Industry norm, physical role demands
Technology and SaaS 13–18% Healthy range, competition for senior talent
Financial Services 10–15% Stable, regulated environments retain longer
Professional Services 12–18% Expected, project-based career transitions
Education (K–12 and Higher Ed) 15–20% Rising, compensation pressure increasing
Nonprofit 20–25% Elevated, compensation gap with the private sector

Important context: These are total turnover rates. Voluntary turnover rates are typically 60–70% of the total figure. A SaaS company at 16% total turnover would expect voluntary turnover of approximately 10–12%. Anything significantly above that warrants investigation.

Practitioner Insight Β  Benchmarks are useful for board conversations and investor reporting. They are not useful for identifying why turnover is happening in your organization. A rate within the benchmark range can still be driven by a single team or manager whose impact is hidden in the aggregate. Use benchmarks for external context. Use manager segmentation for internal action.

How to Calculate the Cost of Employee Turnover

The turnover rate tells you how often employees are leaving. Turnover cost tells you what that departure actually costs the organization. For leadership conversations, cost is usually the more compelling number.

The standard cost-of-turnover framework includes four components:

  • Separation costs: Offboarding administration, exit interviews, unemployment insurance contributions, and any severance.
  • Replacement costs: Job posting fees, recruiter time or external agency fees, interview coordination, and background checks.
  • Onboarding and training costs: Onboarding program costs, manager time for ramp-up, training materials, and technology access setup.
  • Productivity loss: The period between an employee departing and their replacement reaching full productivity. For knowledge roles, this typically runs 3 to 6 months.

Cost estimates by role level (commonly cited ranges, based on SHRM and Gallup research):

Role Level Estimated Cost Range Primary Driver
Frontline / Hourly 50–100% of annual salary Replacement recruitment and short ramp
Individual Contributor 75–150% of annual salary Productivity loss during vacancy and ramp
Manager / Senior IC 100–200% of annual salary Knowledge transfer and team disruption
Senior Leader / Executive 200–400% of annual salary Strategic impact and extended search time

Example: A 200-person SaaS company at 15% annual turnover loses 30 employees per year. If the average salary is $80,000 and the average replacement cost is 100% of salary, the annual turnover cost is approximately $2.4 million. A 5-percentage-point reduction in voluntary turnover: 10 fewer departures: saves roughly $800,000.

Employee Retention Rate Formula: The Inverse Metric

Retention rate and turnover rate measure the same dynamic from opposite directions. Some leadership teams find retention rate easier to communicate because it frames the metric positively.

Employee Retention Rate Formula:

Retention RateΒ  =Β  [ ( Employees at End of Period βˆ’ New Hires During Period )Β  Γ·Β  Employees at Start of Period ]Β  Γ—Β  100

Example: A company starts Q3 with 200 employees, hires 20 new employees during Q3, and ends Q3 with 195 employees.

= [ ( 195 βˆ’ 20 ) Γ· 200 ] Γ— 100 = [ 175 Γ· 200 ] Γ— 100 = 87.5% retention rate

Note: New hires are excluded from the retention numerator because retaining an employee who has only been with the organization for two weeks is not the same achievement as retaining a three-year tenured employee.

What Turnover Data Actually Tells You About Manager Effectiveness

The most actionable use of turnover data is not comparing your rate to industry benchmarks. It is segmenting your voluntary turnover rate by manager and cross-referencing it with check-in frequency data.

Research across multiple workforce analytics studies consistently shows that manager quality is the primary driver of voluntary turnover in knowledge worker roles. Employees do not leave organizations; they leave managers. This pattern shows up in turnover data when you have the right segmentation.

The Check-in Frequency Signal

In organizations that track manager coaching cadence, a consistent pattern emerges: managers with low check-in frequency have higher voluntary turnover rates for their direct reports. The relationship is not perfect; other factors contribute, but it is reliable enough to be actionable.

The leading indicator appears 8 to 12 weeks before the resignation. A manager's check-in frequency drops. Pulse survey scores for that team decline. The resignation follows. By the time the resignation arrives, the underlying signal was already visible in the operational data for two to three months.

How to Use This in Practice

Run a quarterly analysis that cross-references the voluntary turnover rate by manager against the check-in completion rate by manager. Any manager with voluntary turnover above your company's average and check-in frequency below your company's average is the most predictable source of future turnover in your organization.

PerformSpark's check-in tracking surfaces manager coaching frequency alongside pulse survey scores so HR can identify the combination before it becomes a resignation, not after it appears in your monthly turnover report.

Common Turnover Rate Calculation Mistakes to Avoid

  • Using headcount at the end of the period as the denominator: This understates the rate when headcount grew during the period. Always use average headcount, (start + end) Γ· 2, as the denominator.
  • Annualizing by multiplying the monthly rate by 12: This overstates the annual rate. Use the compound formula: [1 βˆ’ (1 βˆ’ monthly rate)^12] Γ— 100.
  • Combining voluntary and involuntary turnover: You cannot identify the cause of turnover from a combined number. Track them separately from the first report.
  • Reporting only the company-wide number: Department and manager segmentation is where the actionable signal lives. A healthy company-wide rate can hide a critical team-level problem.

Including internal transfers in separations: An employee who moves from the engineering team to the product team is not a separation. Transfers should be excluded from turnover calculations.

Frequently Asked Questions

What is the formula for calculating employee turnover rate?

What is a good employee turnover rate?

What is the difference between voluntary and involuntary turnover?

How do you calculate turnover rate for a specific department or team?

How does employee turnover connect to performance management?

What is attrition rate, and is it the same as turnover rate?

Make performance reviews your growth lever

No credit card required β€’ Free setup & training included β€’ Cancel anytime

CTA ShapeCTA Shape