
Table of Contents
The average annual engagement survey has 50 to 80 questions and runs once per year. By the time results are analyzed, action plans are created, and any changes are implemented, the issues surfaced are often three to six months old and the employees who surfaced them have already decided how they feel about whether the organization will act.
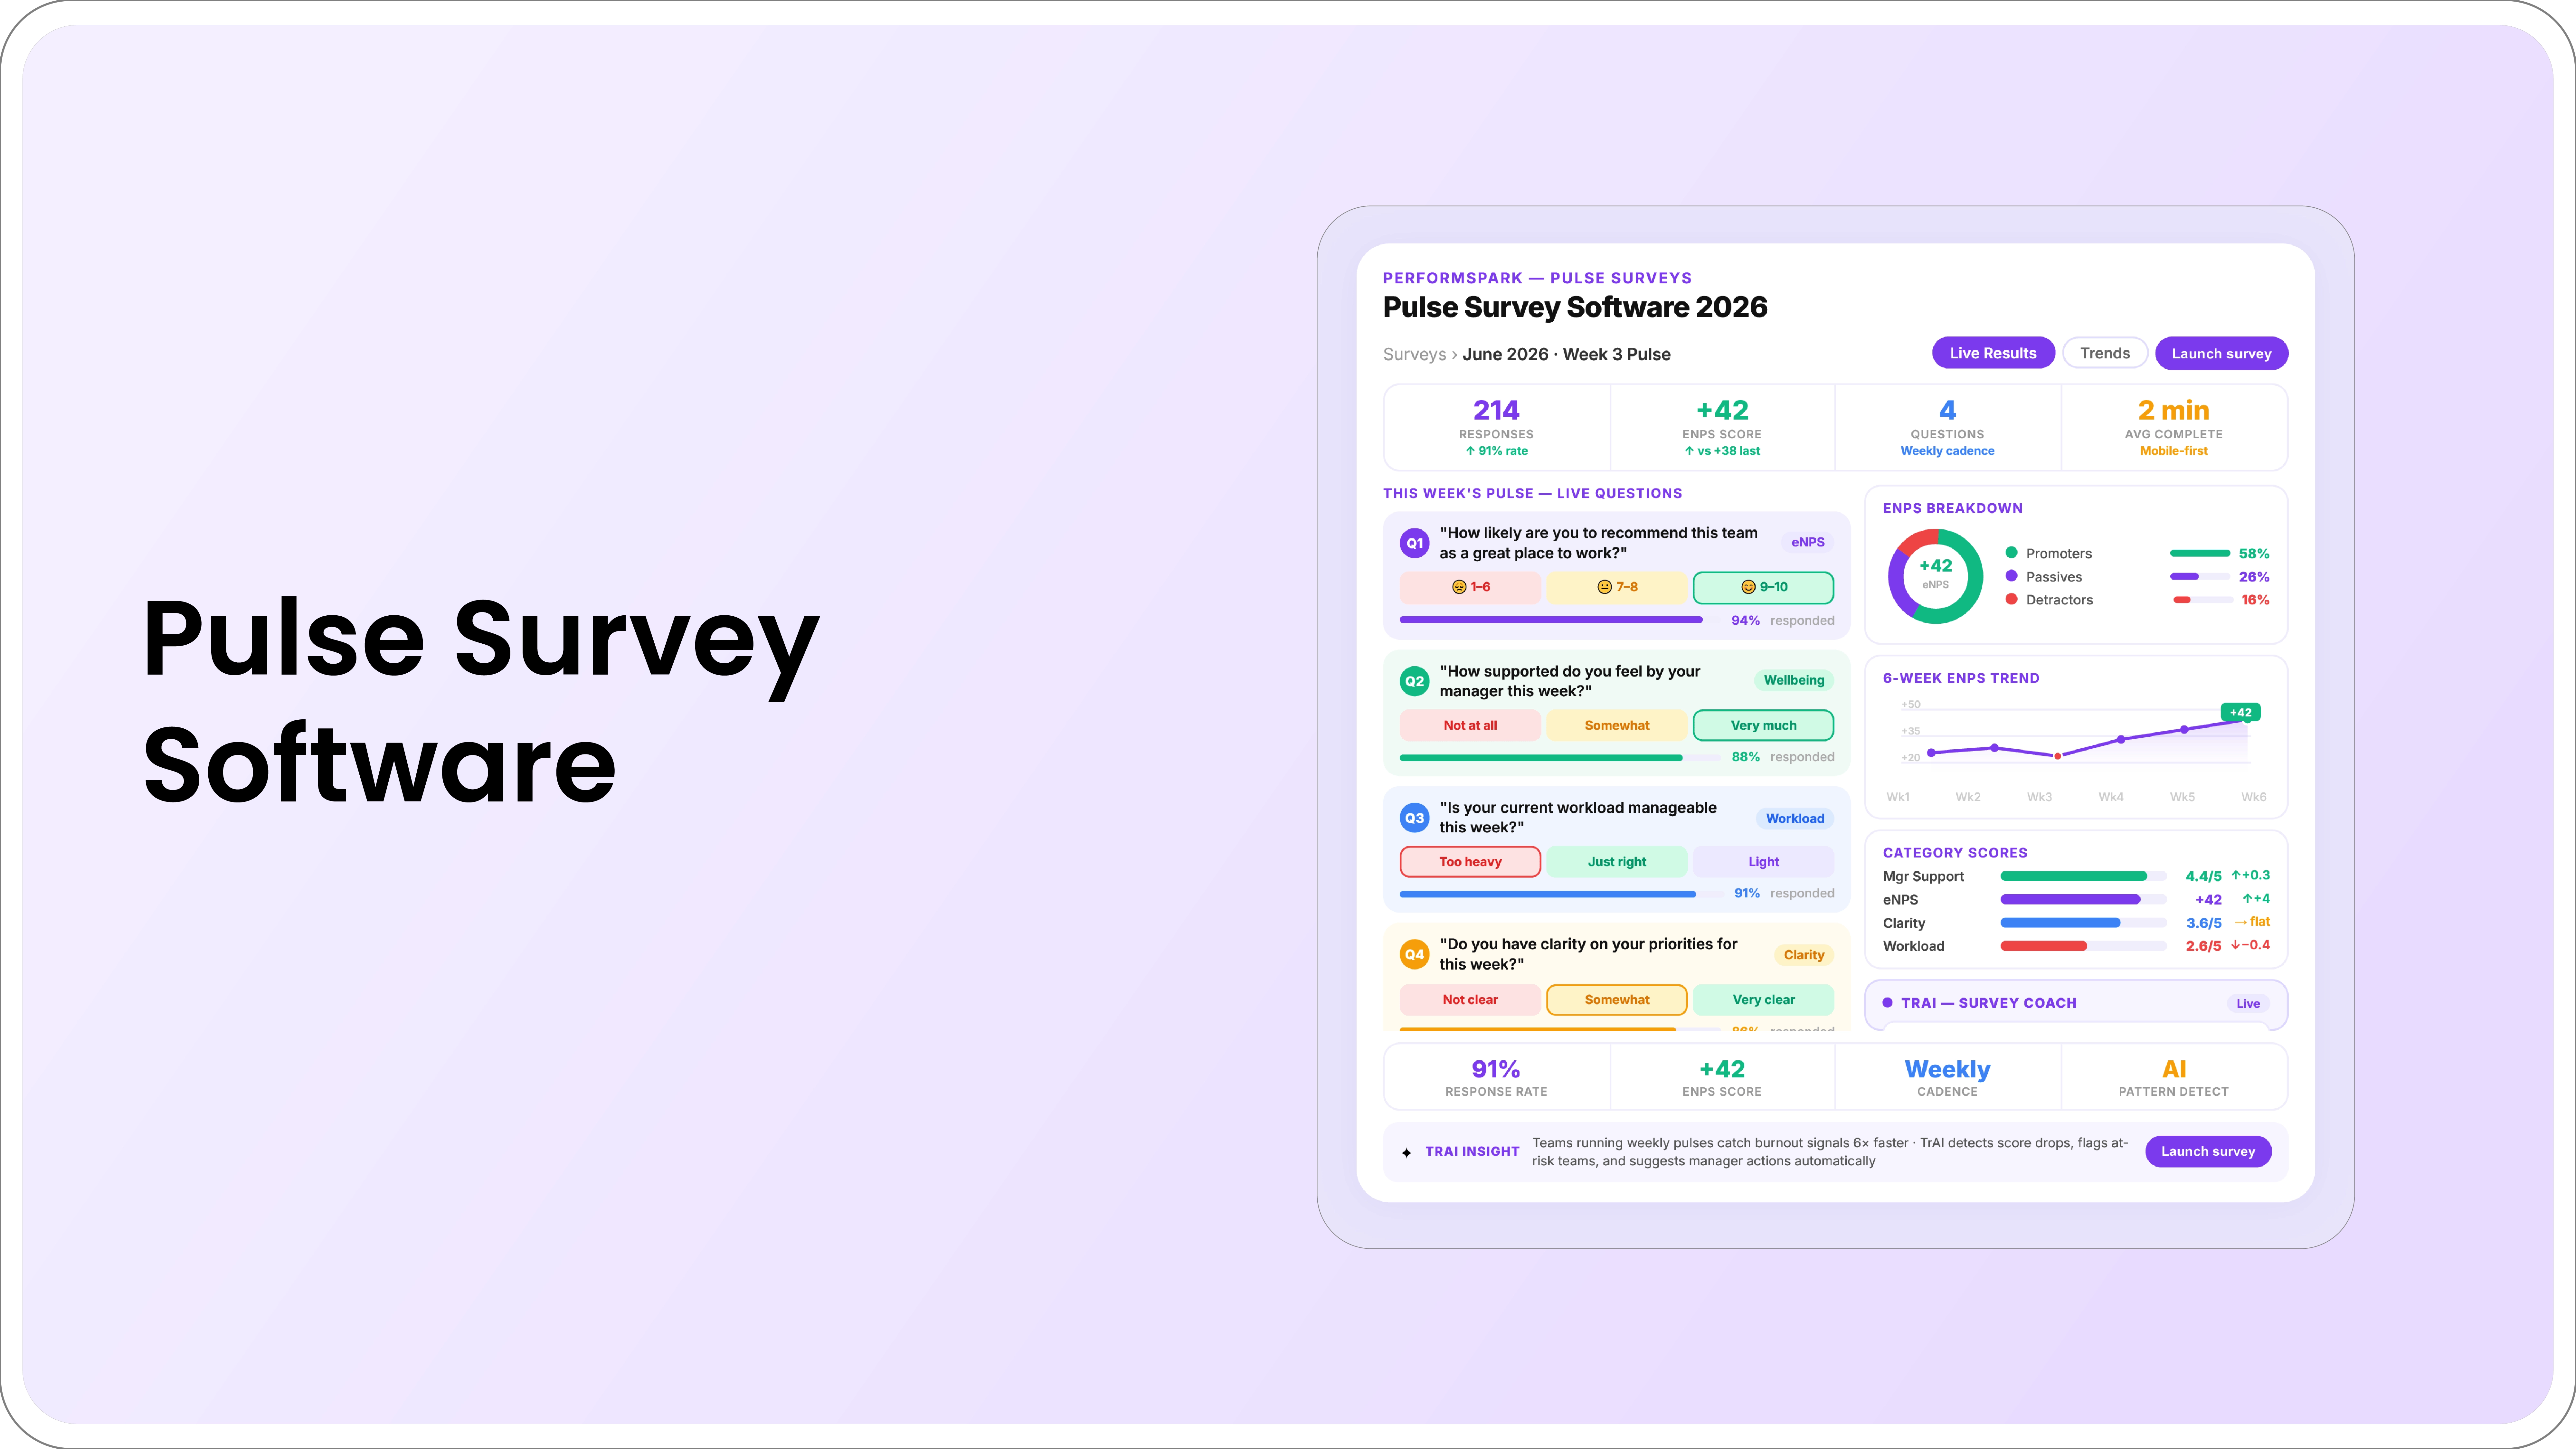
Pulse surveys use 5 to 15 questions and run weekly, biweekly, or monthly. They generate data that HR leaders can act on in the same quarter the signal appears.
The goal is not to replace annual engagement surveys they serve a different purpose. The goal is to fill the 11-month gap between annual measurements with a continuous signal that makes organizational problems visible before they become expensive.
Practitioner Insight A common issue teams run into with pulse programs: they launch the survey, collect the data, and then pause to build an action plan. By the time the action plan is presented, employees have already concluded that the survey produced no change. Pulse programs require a faster feedback loop than annual surveys acknowledging themes and committing to one visible action within 2–3 weeks of a result is the minimum that maintains participation.
Annual Engagement Survey vs Pulse Survey — What Each Does Well
What Employee Pulse Survey Software Actually Automates
Without dedicated software, running a pulse survey program manually creating surveys, distributing them, collecting responses, maintaining anonymity, aggregating results, and presenting trends consumes more HR time than the program is worth. Software removes the operational burden from every step.
Survey creation and question library
Pre-validated engagement question libraries remove the guesswork from question design. Questions that have been validated across thousands of organizations produce more reliable results than custom questions created in-house and they enable benchmark comparison.
Automated distribution and cadence management
The survey goes out on the configured schedule without HR action each cycle. Response reminders, anonymization, and collection are handled automatically.
Trend analysis and comparison
Results are compared automatically to previous periods not just the current score but whether the score is improving or declining and at what rate. For teams that are flagged, the comparison shows when the decline started.
Alert generation
When a team's score drops below a defined threshold, or when the trend shows consistent decline over multiple cycles, the system generates an alert to HR or the relevant leader. This is the feature that makes pulse surveys proactive rather than retrospective.
Manager-level visibility with privacy protection
Disaggregated results by team are available to managers and HR with minimum response thresholds to protect anonymity. Managers see their own team results; HR sees the full organizational view.
How Pulse Survey Data Connects to Performance and Retention Data
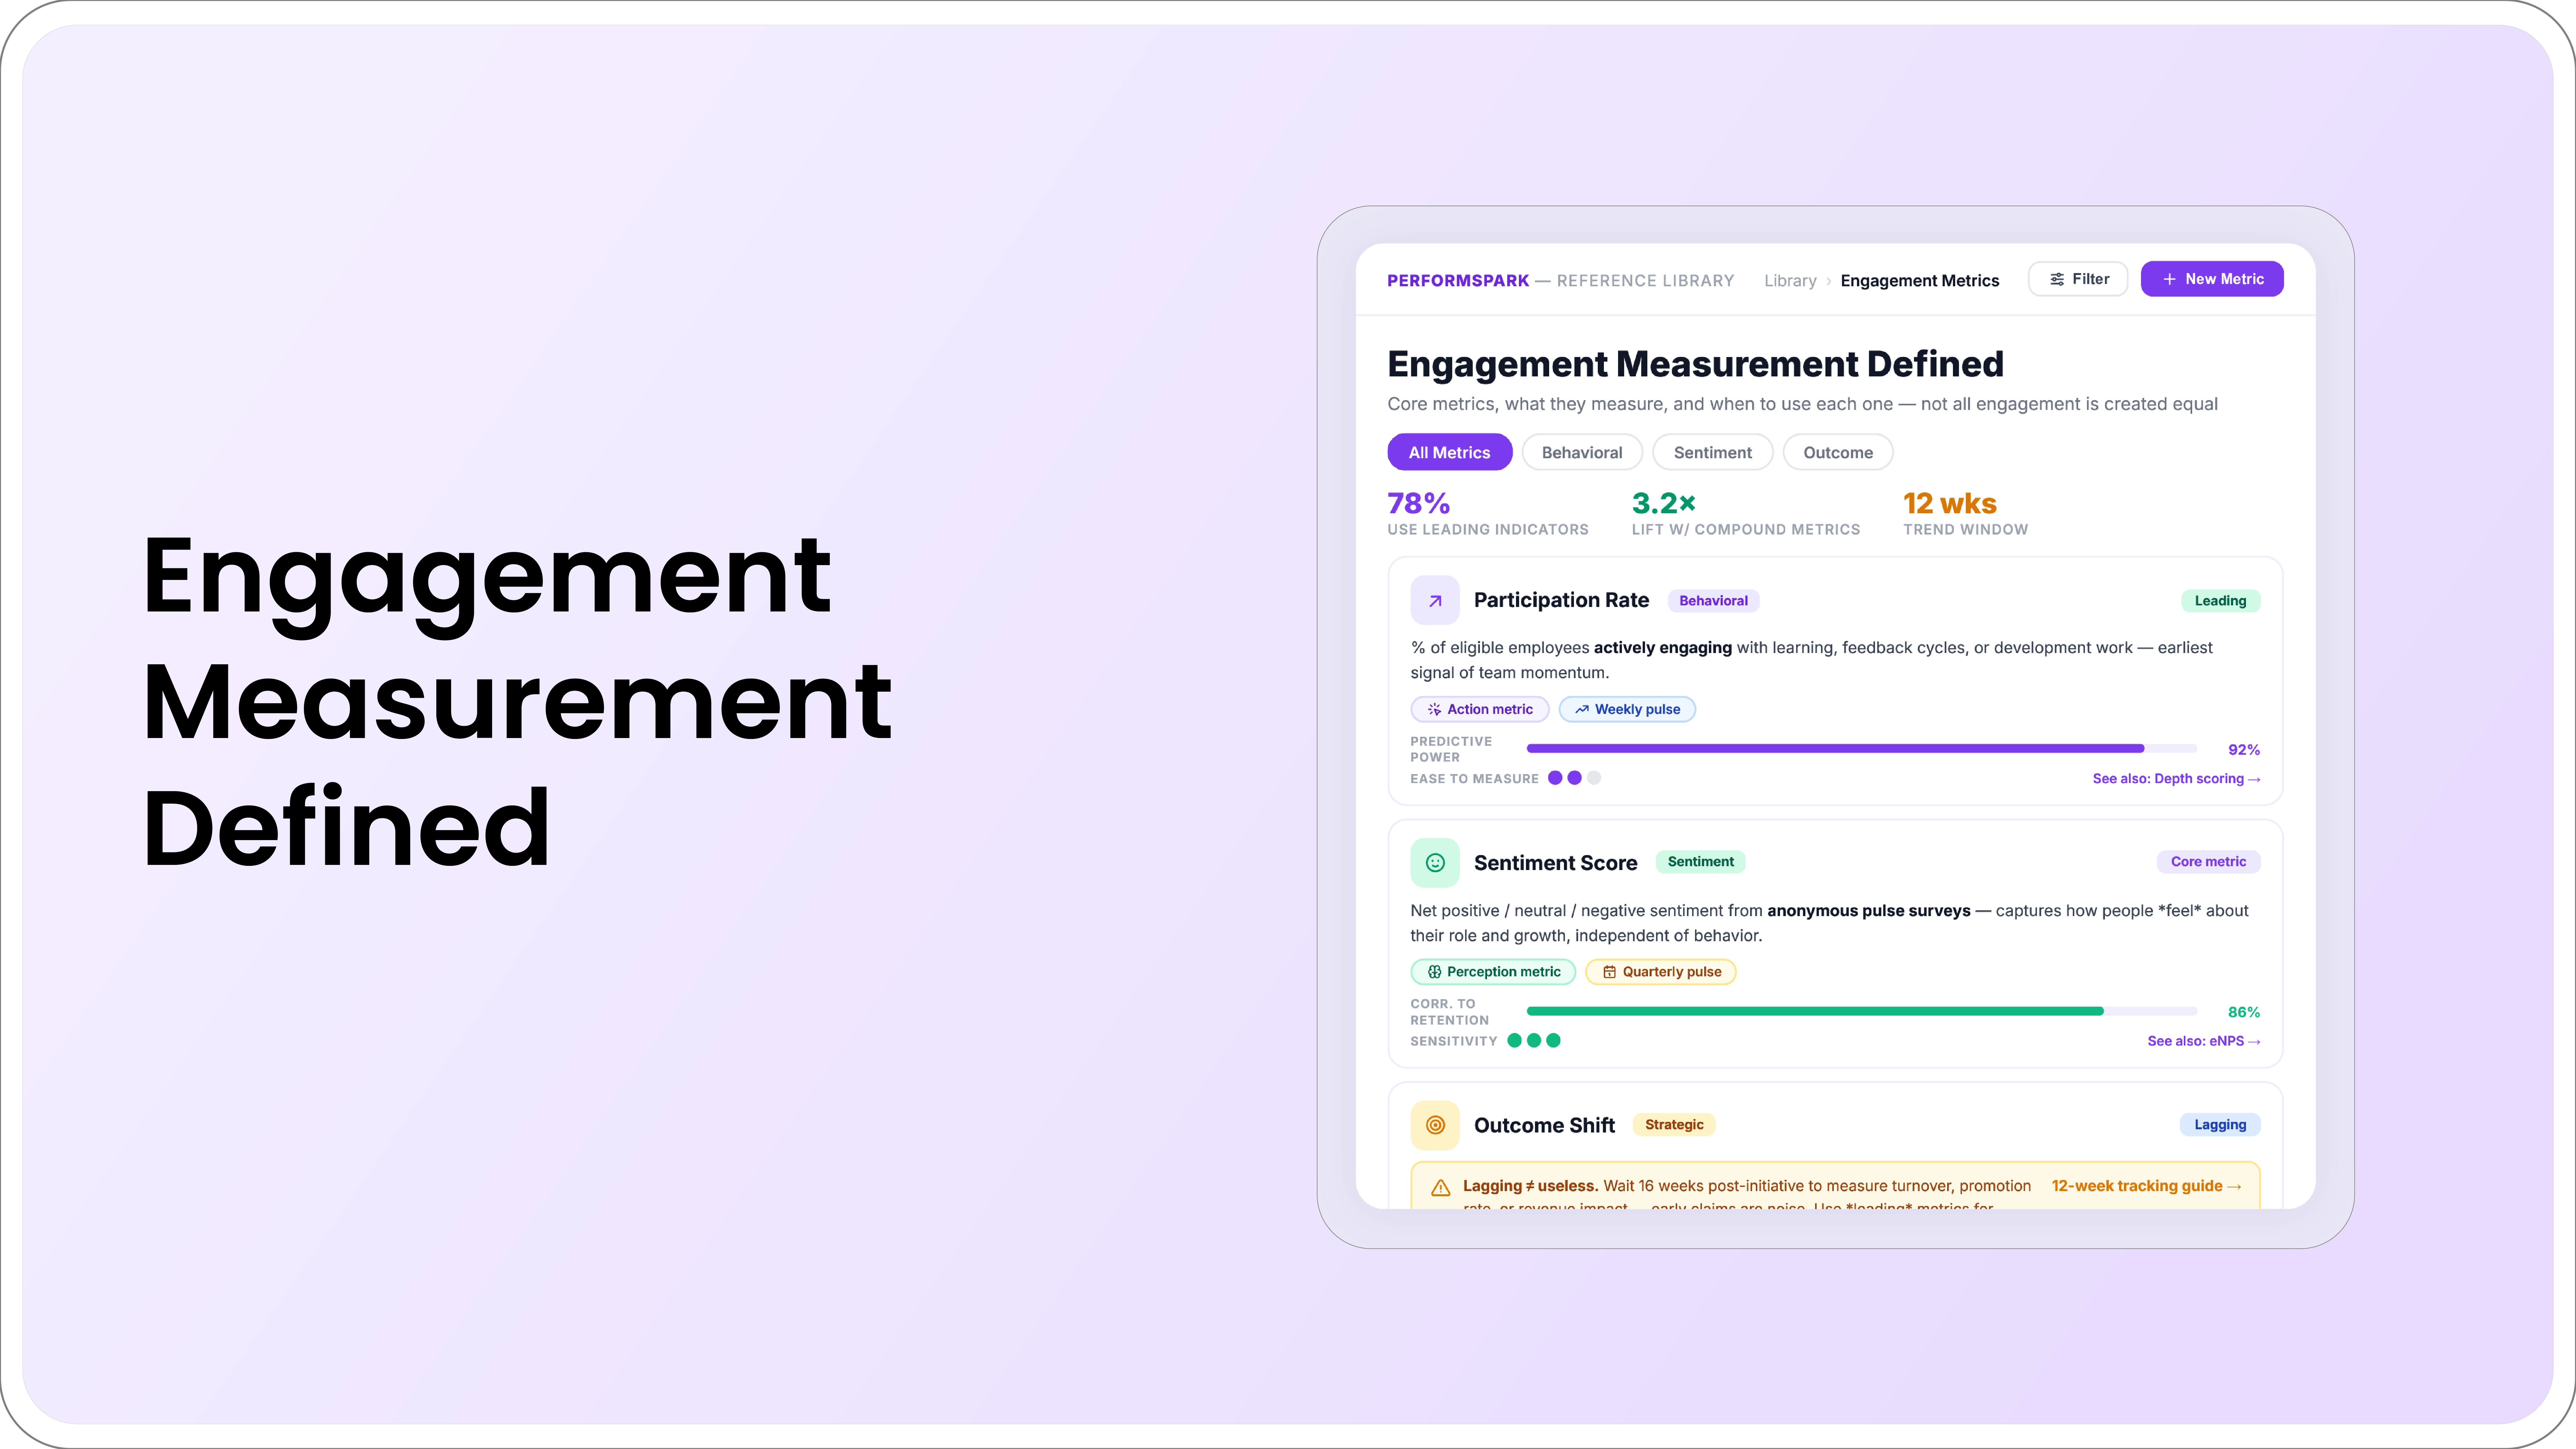
The standalone pulse score "team engagement is 7.2 this month" is interesting. The correlation between that score and other operational data is what makes it actionable.
The check-in frequency signal
When pulse survey scores for a specific team decline at the same time that the manager's check-in frequency drops in the check-in tracking data, HR has a compounding signal. One data point is noise. Two correlated data points from different sources engagement dropping as coaching drops is a pattern that warrants a direct conversation with the manager before either trend worsens.
This correlation typically appears 8 to 12 weeks before a voluntary resignation. The check-in frequency drops first. The pulse score follows. The resignation is last. By the time the resignation lands, the signal was visible for two to three months in the operational data.
The performance review connection
Pulse data captured during the review period provides qualitative context for the quantitative ratings. A team with declining pulse scores during Q3 and a manager whose check-in records are sparse is a calibration signal. When the manager submits a cohort of high ratings for that team in Q4, the pulse and check-in data gives HR a basis for probing the evidence behind those ratings in the calibration session.
The IDP and development connection
Pulse survey responses that consistently surface themes about career development employees not seeing a clear growth path, not feeling their development is supported are direct signals for IDP program health. If employees are raising development concerns in pulse surveys but managers are not creating or updating IDPs, the disconnect between the data and the development practice is visible.
PerformSpark surfaces pulse survey data alongside check-in frequency and performance rating data in the same view, so HR leaders can see the correlations without building a manual analysis from multiple data exports. The operational picture is assembled automatically.
- This is the correlation that transforms pulse survey data from an engagement score into a retention management tool. PerformSpark surfaces pulse scores alongside check-in frequency in the same view, without requiring a manual data export or a cross-referencing exercise.
- The signal is visible in the HR dashboard before the resignation conversation happens. See how pulse data connects to check-in records in PerformSpark →
What to Look for in Employee Pulse Survey Software
Not all pulse survey tools are purpose-built for performance management integration. Here are the six criteria that matter most for mid-market HR teams.
Validated question libraries
Pre-validated questions produce more reliable trend data than custom questions. Look for question libraries with documented reliability and the ability to compare your scores to external benchmarks.
Configurable cadence
Weekly, biweekly, and monthly cadences serve different purposes. A platform that forces a single cadence reduces your ability to match the survey frequency to the organizational context.
Minimum response threshold enforcement
Anonymity protection is not optional. The platform must enforce a minimum response count before disaggregated results are shown and must communicate clearly to managers when results are withheld to protect individual privacy.
Performance data integration
Standalone pulse software that cannot connect results to check-in data, manager records, or performance ratings produces isolated data. The value is in the correlation. Look for platforms where pulse lives alongside performance in the same system.
Manager-level visibility with appropriate access controls
Managers should see their team results. They should not see each other's team results. HR should see all results. Access controls that enforce this separation are a baseline requirement.
Alert and notification workflows
Automated alerts when scores drop below defined thresholds are what make a pulse program proactive. Without this, pulse data is still retrospective someone has to notice the trend and decide to act.
How to Maintain Pulse Survey Participation Over Time
The single biggest risk to a pulse program is declining participation. Employees who complete a survey and observe no visible response no acknowledgment, no change, no communication will stop completing subsequent surveys. Within two or three cycles, a non-responsive pulse program effectively collapses.
The participation maintenance model that works is straightforward: within two to three weeks of each survey cycle, the team's manager or HR communicates one visible thing. Not a comprehensive action plan. Not a strategy document. One specific acknowledgment of what was heard and one specific commitment to what will be different.
This does not require resolving every concern surfaced. It requires demonstrating that the survey is read, that the results influence decisions, and that employees are not submitting into a void.
Practitioner Insight: Pulse programs that close the loop publicly "In last month's survey, several people raised the meeting volume issue. We've removed two recurring meetings from the team calendar effective this week" consistently show 15–25% higher participation in subsequent cycles compared to programs that communicate action plans internally without visible operational change.
Most pulse survey tools give you a score. PerformSpark gives you the correlation.
When a team's engagement drops at the same time their manager's check-in frequency drops, that compound signal is visible in a single dashboard view — and a 14-day check-in alert fires automatically before the trend becomes a resignation.
If you are evaluating pulse survey tools as part of a performance management platform decision, the demo shows you how the full signal picture works together, not a standalone engagement score in a separate system.
See the pulse-to-performance connection in a PerformSpark demo → Book a demo
Quick Takeaways: Employee Pulse Survey Software
- Annual engagement surveys tell you there is a problem. Pulse surveys tell you which team, which manager, and when the problem started.
- The most valuable pulse data is not the score it is the trend. A score of 7 is informative. A score of 7 that was 8.5 six weeks ago is actionable.
- Pulse survey anonymity only holds if teams are large enough that individual responses cannot be inferred from aggregated results. Groups smaller than 5–7 should not receive disaggregated pulse results.
- Connecting pulse scores to check-in frequency data reveals the manager-level correlation that predicts voluntary turnover 8–12 weeks before resignation.
- High response rates require that employees see action taken on previous results. A pulse program that asks and never visibly acts loses participation within two or three cycles.
The average annual engagement survey has 50 to 80 questions and runs once per year. By the time results are analyzed, action plans are created, and any changes are implemented, the issues surfaced are often three to six months old and the employees who surfaced them have already decided how they feel about whether the organization will act.
Pulse surveys use 5 to 15 questions and run weekly, biweekly, or monthly. They generate data that HR leaders can act on in the same quarter the signal appears.
The goal is not to replace annual engagement surveys they serve a different purpose. The goal is to fill the 11-month gap between annual measurements with a continuous signal that makes organizational problems visible before they become expensive.
Practitioner Insight A common issue teams run into with pulse programs: they launch the survey, collect the data, and then pause to build an action plan. By the time the action plan is presented, employees have already concluded that the survey produced no change. Pulse programs require a faster feedback loop than annual surveys acknowledging themes and committing to one visible action within 2–3 weeks of a result is the minimum that maintains participation.
Annual Engagement Survey vs Pulse Survey — What Each Does Well
What Employee Pulse Survey Software Actually Automates
Without dedicated software, running a pulse survey program manually creating surveys, distributing them, collecting responses, maintaining anonymity, aggregating results, and presenting trends consumes more HR time than the program is worth. Software removes the operational burden from every step.
Survey creation and question library
Pre-validated engagement question libraries remove the guesswork from question design. Questions that have been validated across thousands of organizations produce more reliable results than custom questions created in-house and they enable benchmark comparison.
Automated distribution and cadence management
The survey goes out on the configured schedule without HR action each cycle. Response reminders, anonymization, and collection are handled automatically.
Trend analysis and comparison
Results are compared automatically to previous periods not just the current score but whether the score is improving or declining and at what rate. For teams that are flagged, the comparison shows when the decline started.
Alert generation
When a team's score drops below a defined threshold, or when the trend shows consistent decline over multiple cycles, the system generates an alert to HR or the relevant leader. This is the feature that makes pulse surveys proactive rather than retrospective.
Manager-level visibility with privacy protection
Disaggregated results by team are available to managers and HR with minimum response thresholds to protect anonymity. Managers see their own team results; HR sees the full organizational view.
How Pulse Survey Data Connects to Performance and Retention Data
The standalone pulse score "team engagement is 7.2 this month" is interesting. The correlation between that score and other operational data is what makes it actionable.
The check-in frequency signal
When pulse survey scores for a specific team decline at the same time that the manager's check-in frequency drops in the check-in tracking data, HR has a compounding signal. One data point is noise. Two correlated data points from different sources engagement dropping as coaching drops is a pattern that warrants a direct conversation with the manager before either trend worsens.
This correlation typically appears 8 to 12 weeks before a voluntary resignation. The check-in frequency drops first. The pulse score follows. The resignation is last. By the time the resignation lands, the signal was visible for two to three months in the operational data.
The performance review connection
Pulse data captured during the review period provides qualitative context for the quantitative ratings. A team with declining pulse scores during Q3 and a manager whose check-in records are sparse is a calibration signal. When the manager submits a cohort of high ratings for that team in Q4, the pulse and check-in data gives HR a basis for probing the evidence behind those ratings in the calibration session.
The IDP and development connection
Pulse survey responses that consistently surface themes about career development employees not seeing a clear growth path, not feeling their development is supported are direct signals for IDP program health. If employees are raising development concerns in pulse surveys but managers are not creating or updating IDPs, the disconnect between the data and the development practice is visible.
PerformSpark surfaces pulse survey data alongside check-in frequency and performance rating data in the same view, so HR leaders can see the correlations without building a manual analysis from multiple data exports. The operational picture is assembled automatically.
- This is the correlation that transforms pulse survey data from an engagement score into a retention management tool. PerformSpark surfaces pulse scores alongside check-in frequency in the same view, without requiring a manual data export or a cross-referencing exercise.
- The signal is visible in the HR dashboard before the resignation conversation happens. See how pulse data connects to check-in records in PerformSpark →
What to Look for in Employee Pulse Survey Software
Not all pulse survey tools are purpose-built for performance management integration. Here are the six criteria that matter most for mid-market HR teams.
Validated question libraries
Pre-validated questions produce more reliable trend data than custom questions. Look for question libraries with documented reliability and the ability to compare your scores to external benchmarks.
Configurable cadence
Weekly, biweekly, and monthly cadences serve different purposes. A platform that forces a single cadence reduces your ability to match the survey frequency to the organizational context.
Minimum response threshold enforcement
Anonymity protection is not optional. The platform must enforce a minimum response count before disaggregated results are shown and must communicate clearly to managers when results are withheld to protect individual privacy.
Performance data integration
Standalone pulse software that cannot connect results to check-in data, manager records, or performance ratings produces isolated data. The value is in the correlation. Look for platforms where pulse lives alongside performance in the same system.
Manager-level visibility with appropriate access controls
Managers should see their team results. They should not see each other's team results. HR should see all results. Access controls that enforce this separation are a baseline requirement.
Alert and notification workflows
Automated alerts when scores drop below defined thresholds are what make a pulse program proactive. Without this, pulse data is still retrospective someone has to notice the trend and decide to act.
How to Maintain Pulse Survey Participation Over Time
The single biggest risk to a pulse program is declining participation. Employees who complete a survey and observe no visible response no acknowledgment, no change, no communication will stop completing subsequent surveys. Within two or three cycles, a non-responsive pulse program effectively collapses.
The participation maintenance model that works is straightforward: within two to three weeks of each survey cycle, the team's manager or HR communicates one visible thing. Not a comprehensive action plan. Not a strategy document. One specific acknowledgment of what was heard and one specific commitment to what will be different.
This does not require resolving every concern surfaced. It requires demonstrating that the survey is read, that the results influence decisions, and that employees are not submitting into a void.
Practitioner Insight: Pulse programs that close the loop publicly "In last month's survey, several people raised the meeting volume issue. We've removed two recurring meetings from the team calendar effective this week" consistently show 15–25% higher participation in subsequent cycles compared to programs that communicate action plans internally without visible operational change.
Most pulse survey tools give you a score. PerformSpark gives you the correlation.
When a team's engagement drops at the same time their manager's check-in frequency drops, that compound signal is visible in a single dashboard view — and a 14-day check-in alert fires automatically before the trend becomes a resignation.
If you are evaluating pulse survey tools as part of a performance management platform decision, the demo shows you how the full signal picture works together, not a standalone engagement score in a separate system.
See the pulse-to-performance connection in a PerformSpark demo → Book a demo
.webp)
.webp)


.svg)

.svg)
.svg)

